
The Retracement Finder Metatrader 4 forex indicator is a technical tool that defines all price movements that are against the main trend.
The indicator consists of colored histograms that are aligned above and below the zero signal level.
Interpretation
A move below the zero level is considered a retracement and when the Retracement Finder indicator moves back above zero, such a retracement is considered to be completed and the overall trend is continuing.
The default period for the Retracement Finder indicator is 8, but I’ve adjusted it to 20 to suit my preference.
Free Download
Download the “retracement-finder.ex4” MT4 indicator
Example Chart
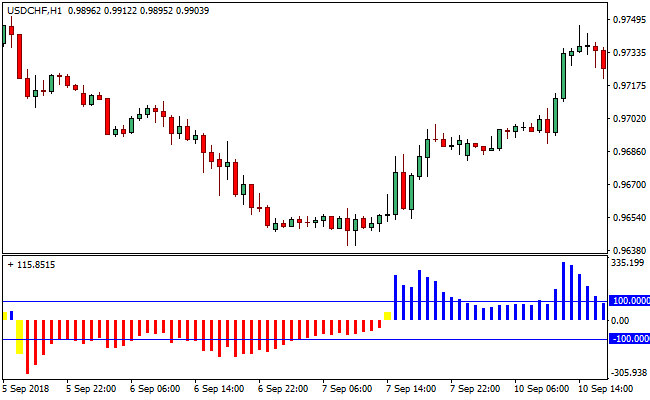
The USD/CHF H1 chart below displays the Retracement Finder Metatrader 4 forex indicator in action.
Basic Trading Signals
Buy Signal: Go long when the Retracement Finder Metatrader 4 forex indicator pops up its first blue histogram that breaks above the 100 level following a yellow bar that forms above the zero level.
Sell Signal: Go short when the Retracement Finder Metatrader 4 forex indicator puts on display its first red histogram that dips below the -100 level following a yellow bar that forms below the zero level.
Exit buy trade: Close all buy orders if while a bullish trend is ongoing, the Retracement Finder indicator pops up a yellow histogram below the zero signal level.
Exit sell trade: Close all sell orders if while a bearish trend is running, the Retracement Finder indicator pops up a yellow histogram above the zero signal level.
Tips: We added two horizontal levels to the indicator at -100 and +100 to help us clearly define a retracement that is too small and those that are notable.
Download
Download the “retracement-finder.ex4” Metatrader 4 indicator
MT4 Indicator Characteristics
Currency pairs: Any
Platform: Metatrader 4
Type: chart window indicator
Customization options: Variable (A_period=20, num_bars, UseAlert, UseEmail), width & Style.
Time frames: 1-Minute, 5-Minutes, 15-Minutes, 30-Minutes, 1-Hour, 4-Hours, 1-Day, 1-Week, 1-Month
Type: trend | retracement
Installation
Copy and paste the retracement-finder.ex4 indicator into the MQL4 indicators folder of the Metatrader 4 trading platform.
You can access this folder from the top menu as follows:
File > Open Data Folder > MQL4 > Indicators (paste here)


