
About the Reversal Stop Signal Indicator
The Reversal Stop Signal forex indicator for MT4 focuses on spotting potential short-term trend reversals directly on the price chart.
It scans recent price behavior and highlights moments where market momentum shifts from bullish to bearish, or the other way around.
This makes it useful for traders who want to react early to changing conditions.
The indicator plots colored bullets on the chart to represent reversal signals.
Green bullets appear when price shows signs of turning upward after a bearish move.
Red bullets appear when bullish momentum weakens and price starts turning lower.
These signals aim to capture short bursts of movement rather than long trend legs.
This tool works best in active market sessions where price moves with intent.
Scalpers and intraday traders often use it to time entries after pullbacks or exhaustion moves.
For better consistency, many traders combine it with a higher-timeframe trend filter to stay aligned with the dominant market direction.
Free Download
Download the “bb-stops-v2-indicator.mq4” MT4 indicator
Key Features
- Plots green and red bullets to highlight possible reversal points.
- Designed for short-term trading and fast decision-making.
- Works on multiple timeframes for scalping and intraday setups.
- Simple visual logic that does not overload the chart.
- Combines well with moving averages and trend filters.
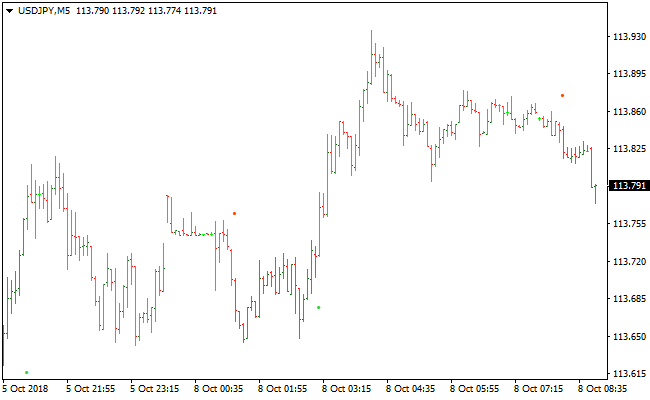
Indicator Chart
The Reversal Stop Signal indicator chart shows price action with colored bullets marking potential buy and sell reversals.
Green bullets highlight bullish turnarounds, while red bullets point to bearish shifts.
The chart helps traders quickly spot entry opportunities within the current market context.
Guide to Trade with Reversal Stop Signal Indicator
Buy Rules
- Wait for a green bullet to appear on the chart.
- Confirm price is above a higher-timeframe trend filter.
- Enter a buy trade at the close of the signal candle.
- Avoid buy signals during strong bearish momentum.
Sell Rules
- Wait for a red bullet to appear on the chart.
- Confirm price is below a higher-timeframe trend filter.
- Enter a sell trade at the close of the signal candle.
- Avoid sell signals during strong bullish momentum.
Stop Loss
- For buy trades, set the stop loss a few pips below the candle that triggered the green bullet.
- For sell trades, place the stop loss a few pips above the candle that triggered the red bullet.
- Adjust the stop to nearby price reactions to match short-term market conditions.
Take Profit
- Close the trade when an opposite colored bullet appears.
- Alternatively, target a nearby support or resistance level.
- Consider partial profits during strong but brief price moves.
Reversal Stop Signal + Renko Boxes MT4 Trading Strategy
This MT4 strategy combines the precision of the Reversal Stop Signal indicator with the clear price structure delivered by the Renko Boxes indicator.
Both indicators complement each other, making this setup suitable for day traders and swing traders who prefer simple chart reading without unnecessary noise.
The Reversal Stop Signal plots green and red bullets that mark potential turning points.
The Renko Boxes show clean bullish and bearish momentum by painting blue boxes for upward movement and red boxes for downward movement.
Together, they help traders filter signals, confirm trend direction and execute trades with confidence.
This strategy works well on M15, M30 and H1 charts, but can also be applied on higher time frames for more conservative trading.
Buy Entry Rules
- The Reversal Stop Signal plots a green bullet on the chart.
- The Renko Boxes show a blue box at the same moment or one box after the signal.
- Wait for the candle to close to avoid early entries.
- Stop loss goes below the most recent swing low.
- Take profit at the next Renko structure level or after a fixed number of pips, such as 25 to 40 depending on volatility.
Sell Entry Rules
- The Reversal Stop Signal plots a red bullet on the chart.
- The Renko Boxes show a red box confirming bearish momentum.
- Wait for the candle to close before opening the trade.
- Stop loss goes above the latest swing high.
- Take profit at the next Renko barrier or after 25 to 40 pips.
Advantages
- Easy to read because both indicators give visual and direct signals.
- Works well in trending phases when Renko structures clearly expand.
- Can be applied on multiple time frames without changing the logic.
- Filters out weak signals because both indicators must agree before opening a trade.
Drawbacks
- Flat markets may produce small boxes and more false signals.
- Requires discipline to wait for candle close confirmation.
- Stop losses may be wide on higher time frames.
- Strong news releases can invalidate Renko box formations quickly.
Example Case Study 1
On EURUSD M30, the Reversal Stop Signal printed a green bullet after a short pullback.
The Renko Boxes immediately shifted to blue, showing renewed bullish strength.
A buy trade was opened at the close of the signal candle.
The stop loss was placed below the previous swing low and the take profit target was set slightly above the next Renko structure.
Price continued in the same direction and delivered a gain of about 38 pips before momentum slowed.
Example Case Study 2
On GBPJPY H1, a red bullet appeared during a strong bearish phase.
A new red Renko box formed shortly after, confirming the downward movement.
A sell position was placed at the close of the signal candle.
Within the next few hours price produced several consecutive red Renko boxes and moved deeper into the trend.
The trade reached its target for a profit of roughly 52 pips before the market retraced.
Strategy Tips
- Wait for at least two consecutive Renko boxes in the same direction to strengthen the confirmation before entering a trade.
- Consider reducing position size when trading during low liquidity sessions because Renko structures may form more slowly.
- Trail the stop loss below each new swing for buys or above each new swing for sells to lock in profits during strong moves.
- If the first Renko box after a signal is very small, skip the trade and wait for a clearer push in the expected direction.
- Mark major support and resistance zones to avoid entering directly into heavy price barriers.
- Use only one trade per signal to avoid overexposure during ranging market conditions.
- Check the economic calendar and avoid entering new trades shortly before major announcements.
- Practice on a demo account first to understand how Renko price flow behaves on your chosen time frame.
Download Now
Download the “bb-stops-v2-indicator.mq4” Metatrader 4 indicator
FAQ
Which timeframe works best with the Reversal Stop Signal Indicator?
The indicator performs best on lower timeframes such as M5 and M15.
These charts provide enough price movement to generate frequent reversal signals without excessive noise.
Can this indicator be used alone?
It can be used on its own, but results often improve when combined with a trend-following tool.
A moving average filter helps avoid countertrend trades.
What market conditions suit this indicator?
Active and moderately volatile markets suit this indicator best.
Flat and slow conditions may reduce signal quality.
Summary
The Reversal Stop Signal indicator for MT4 offers a practical way to spot short-term trend reversals using simple visual signals.
Its bullet-based alerts make it easy to read and quick to act on during active sessions.
This indicator fits traders who focus on scalping and intraday strategies and prefer fast feedback from the market.
When paired with a higher-timeframe trend filter, it can deliver more consistent entries and exits.
While it focuses on short moves, disciplined risk management and confirmation tools can further improve its performance.
With thoughtful use, it becomes a useful addition to a short-term trading toolkit.


