The RSI colored signals indicator for MT4 is an easy-to-follow RSI-based trading indicator with buy/sell alerts painted on the chart.
The indicator draws a green oversold and red overbought RSI signal line in a separate trading window.
Moreover, this RSI indicator draws buy and sell RSI arrows directly on the chart.
You can change the default RSI overbought (70) and oversold (30) values to whatever you wish.
- A green arrow on the chart represents an RSI buy signal (oversold).
- A red arrow on the chart represents an RSI sell signal (overbought).
This RSI indicator works great in a range-bound market, but it will draw false signals in a trending market.
Use the indicator together with moving averages (SMA or EMA) and trade RSI signals in the direction of the underlying trend.
Combine with the 200 SMA, 100 EMA,…
Feel free to experiment with the different indicator’s inputs settings to suit your needs and preferences.
Free Download
Download the “Color RSI with allert.mq4” MT4 indicator
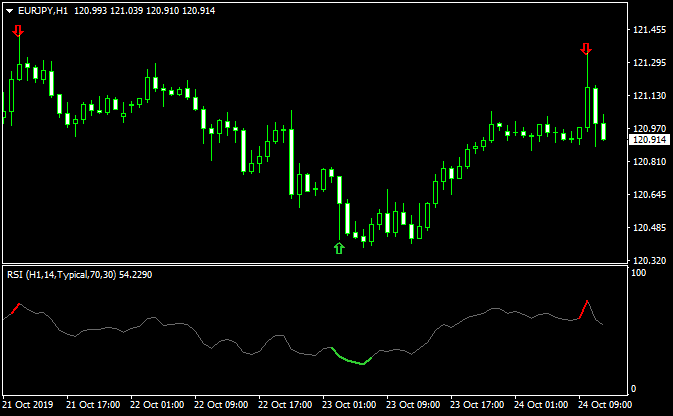
Indicator Chart (EUR/JPY H1)
The EUR/JPY H1 chart below displays the RSI Colored Signals Metatrader 4 forex indicator in action.
Basic Trading Signals
Signals from the RSI Colored Signals MT4 forex indicator are easy to interpret and go as follows:
Buy Signal: Open a buy market order when the RSI Signals indicator paints a green buy arrow on the chart. Make sure the underlying trend is upward.
Place a stop loss below support or use your own preferred SL method.
Sell Signal: Open a sell market order when the RSI Signals indicator paints a red sell arrow on the chart. Make sure the underlying trend is downward.
Place a stop loss above short-term resistance or use your own preferred SL method.
RSI Colored Signals + Awesome OC Indicator Forex Day Trading Strategy
This MT4 strategy combines the RSI Colored Signals indicator with the Awesome OC indicator for exact entry signals.
The RSI Colored Signals indicator shows green arrows for buy signals and red arrows for sell signals.
The Awesome OC histogram confirms trend direction.
Bars above zero indicate a bullish market, while bars below zero confirm bearish momentum.
This day trading approach works well on M15, M30, and H1 charts.
It is suitable for intraday traders who want simple but effective trend-and-signal confirmation.
The Awesome OC helps filter trades by confirming the dominant trend, while the RSI arrows give precise entry timing.
Buy Entry Rules
- The Awesome OC histogram is above zero, confirming a bullish trend.
- A green arrow from the RSI Colored Signals indicator appears.
- Enter a buy trade when both conditions are present.
- Set the stop loss 5 to 10 pips below the most recent swing low.
- Set a take profit target of 20 to 60 pips on M15 or M30, or 40 to 100 pips on H1.
Sell Entry Rules
- The Awesome OC histogram is below zero, confirming bearish momentum.
- A red arrow from the RSI Colored Signals indicator appears.
- Enter a sell trade when both conditions align.
- Set the stop loss 5 to 10 pips above the most recent swing high.
- Set the take profit target between 20 and 60 pips on M15 or M30, or 40 to 100 pips on H1.
Advantages
- Clear and easy-to-read entry signals.
- The trend filter reduces low-quality trades.
- Smooth integration of momentum and signal timing.
- Works well during active trading sessions.
- Gives multiple intraday opportunities.
Drawbacks
- Signals can be unreliable when the Awesome OC stays close to zero.
- RSI arrows may appear during weak momentum without follow-through.
- Whipsaws occur in tight consolidation periods.
- Pairs with high spreads may reduce profitability.
Case Study 1 — EUR/USD on H1
During the London session, the EUR/USD H1 chart showed the Awesome OC histogram rising above zero, confirming bullish momentum.
A green RSI arrow appeared shortly after.
A buy position was opened with the stop loss placed 5 pips below the recent swing low. A take profit of 80 pips was used.
Price pushed higher steadily, and the trade closed with around 78 pips profit.
Case Study 2 — GBP/JPY on M30
On the GBP/JPY M30 chart, the Awesome OC histogram moved below zero, indicating a bearish environment.
Soon after, a red RSI arrow appeared.
A sell order was placed with the stop loss set 10 pips above a recent swing high. A 50 pip take profit was targeted.
Price dropped sharply, and the trade reached 48 pips before reversing slightly.
Strategy Tips
- Avoid trading when the Awesome OC stays near zero for long periods.
- Use trailing stops to secure profits during extended moves.
- Check higher time frames to confirm the broader market direction.
- Focus on pairs with tight spreads for best results.
- Always wait for both the histogram trend and arrow signal before entering.
Download Now
Download the “Color RSI with allert.mq4” Metatrader 4 indicator
MT4 Indicator Characteristics
Currency pairs: Any
Platform: Metatrader 4
Type: chart window indicator
Customization options: Variable (RSI period, price type, time frame, overbought level, oversold level, show arrows on chart, alerts)Width & Style.
Time frames: 1-Minute, 5-Minutes, 15-Minutes, 30-Minutes, 1-Hour, 4-Hours, Daily, Weekly, Monthly
Type: RSI signals

