
About the RSI Divergence Indicator
The RSI Divergence indicator for MT4 is a reversal-focused trading tool that automatically scans price action and the Relative Strength Index to detect divergence patterns.
These patterns often appear when momentum weakens, even though price continues moving in the same direction.
Bullish divergence forms when price makes lower lows while RSI prints higher lows, suggesting selling pressure is fading.
Bearish divergence appears when price makes higher highs but RSI fails to confirm, indicating weakening buying strength.
By highlighting these situations directly on the price area, the indicator helps traders anticipate potential trend changes rather than reacting after the move has already started.
The RSI Divergence indicator can be used across scalping, day trading, and swing trading strategies, offering flexibility while focusing on high-probability reversal zones.
Free Download
Download the “RSI_FWA.mq4” MT4 indicator
Key Features
- Automatically detects bullish and bearish RSI divergences.
- Displays divergence signals directly on the price area.
- Helps identify early trend reversal opportunities.
- Reduces manual chart analysis and visual guesswork.
Indicator Chart
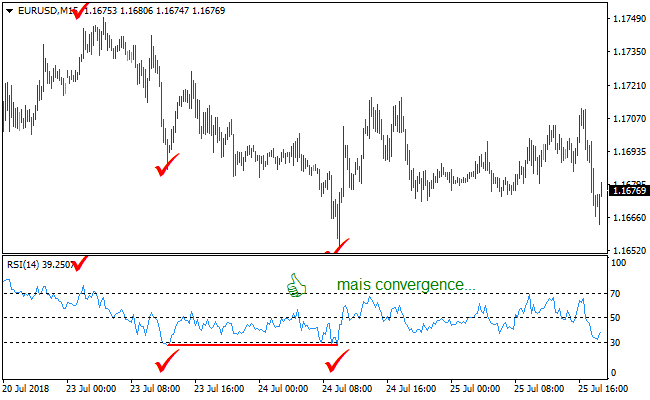
The RSI Divergence indicator appears beneath the main price area and highlights divergence points where price and RSI move out of alignment.
The display shows how momentum weakens before potential reversals, helping traders time entries near exhaustion zones.
Guide to Trade with RSI Divergence Indicator
Buy Rules
- Identify a regular bullish divergence where price makes a lower low but the RSI makes a higher low.
- Ensure the RSI has recently touched or crossed below the 30 level before turning up.
- Wait for a bullish candlestick pattern to close as confirmation of a local bottom.
- Enter a buy order at the opening of the next candle after the divergence line appears.
Sell Rules
- Identify a regular bearish divergence where price makes a higher high but the RSI makes a lower high.
- Ensure the RSI has recently touched or crossed above the 70 level before turning down.
- Wait for a bearish candlestick pattern to close as confirmation of a local top.
- Enter a sell order at the opening of the next candle after the divergence line appears.
Stop Loss
- Place the stop loss a few pips below the most recent swing low for long positions.
- Place the stop loss a few pips above the most recent swing high for short positions.
- Consider using a volatility-based stop if the market is experiencing high fluctuations.
Take Profit
- Target the next major area of support or resistance identified on the higher timeframe.
- Exit the trade when the RSI reaches the opposite extreme level of 70 for buys or 30 for sells.
- Apply a trailing stop once the trade moves significantly into profit to protect your capital.
RSI Divergence and Coron Indicator Forex Trend Strategy for M1 & M5
This MT4 scalping strategy combines the RSI Divergence Indicator with the Coron Indicator to trade short-term momentum reversals in alignment with the prevailing trend.
The RSI Divergence indicator identifies bullish or bearish divergences between price and the RSI, signaling potential trend reversals.
The Coron indicator confirms trend direction with green histogram bars for bullish momentum and red histogram bars for bearish momentum.
This strategy is designed for ultra-short timeframes like M1 and M5 and works best on liquid currency pairs such as EURGBP, AUDUSD, and USDCAD.
Divergence alerts highlight potential entry points, while the Coron trend filter ensures trades align with current market momentum, increasing the probability of success.
Buy Entry Rules
- RSI Divergence shows a bullish divergence, with price making lower lows while RSI makes higher lows.
- Coron histogram bars are green at the time of the signal, confirming bullish momentum.
- Enter long at the close of the candle that confirms both the divergence and green histogram.
- Place the stop loss below the recent swing low to limit risk.
- Exit the trade when the Coron histogram turns red, signaling a reversal in trend.
Sell Entry Rules
- RSI Divergence shows a bearish divergence, with price making higher highs while RSI makes lower highs.
- Coron histogram bars are red at the time of the signal, confirming bearish momentum.
- Enter short at the close of the candle that confirms both the divergence and red histogram.
- Place the stop loss above the recent swing high to control risk.
- Exit the trade when the Coron histogram turns green, indicating a trend reversal.
Advantages
- Combines divergence signals with trend confirmation, improving trade quality.
- Coron histogram gives a clear visual insight into trend direction and exit timing.
- Works well on fast timeframes like M1 and M5 for frequent trading opportunities.
- Helps avoid entering trades against the trend, reducing false signals.
- Simple rules make it easy to follow without overcomplicating entries and exits.
Drawbacks
- Divergences may form in choppy markets, leading to occasional false signals.
- Trend can reverse suddenly on news events, affecting short-term M1 and M5 trades.
- Requires constant attention due to the short timeframes.
- Stop loss placement can occasionally be tested if price consolidates near swing points.
- Less effective in ranging markets where trend and divergence signals conflict.
Case Study 1
On EURGBP M5 during the London session, price formed lower lows while the RSI created higher lows, signaling a bullish divergence.
The Coron histogram was green, confirming upward momentum.
A buy trade was entered at the confirmation candle close.
Price continued upward for 25 pips before the Coron histogram flipped red, signaling the exit.
The stop loss below the recent swing low was never touched.
Case Study 2
On AUDUSD M1 in the New York session, a bearish divergence appeared as price made higher highs while RSI made lower highs.
The Coron histogram showed red bars, confirming the bearish trend.
A sell trade was entered at the close of the confirmation candle.
Price dropped 12 pips before the Coron histogram turned green, marking the exit point.
The stop loss above the recent swing high protected the trade throughout.
Strategy Tips
- Only take divergence signals that align with the Coron trend to increase probability of success.
- Wait for the confirmation candle to close in line with both divergence and trend histogram before entering.
- Monitor the Coron histogram closely for exit cues rather than setting fixed pip targets.
- Focus on one or two pairs per session to manage trades effectively on M1 and M5 charts.
Download Now
Download the “RSI_FWA.mq4” Metatrader 4 indicator
FAQ
Does RSI divergence guarantee a reversal?
No. Divergence signals weakening momentum, not certainty. Confirmation from price behavior improves trade quality.
Which RSI settings work best for divergence trading?
Standard RSI settings work well, but shorter periods may highlight divergences earlier on lower timeframes.
Can this indicator be used during strong trends?
Yes, but divergence signals during strong trends should be treated cautiously and managed with tighter risk control.
Is this indicator better suited for specific markets?
It performs well on liquid markets where momentum shifts develop cleanly, including major forex pairs.
Summary
The RSI Divergence indicator provides a focused approach to spotting potential market reversals by comparing price action with momentum behavior.
It helps traders anticipate changes rather than chasing late entries.
With clear divergence signals and broad timeframe compatibility, this indicator fits traders who prioritize timing, discipline, and controlled risk when trading reversal setups on MT4.


