
About the RSI Signal Divergence indicator
The RSI Signal Divergence indicator for MT4 is a powerful tool that helps traders identify when price action and the RSI oscillator are moving in opposite directions.
This divergence can reveal early signs of potential trend reversals or continuation points, giving traders an edge in planning entries and exits.
In an uptrend, divergence occurs when price makes higher highs but the RSI fails to reach a corresponding high.
Conversely, in a downtrend, divergence happens when price makes lower lows but the RSI does not follow.
These mismatches are often early warnings that the current trend may be weakening or reversing.
The indicator displays divergence clearly in a separate window below the main chart.
Yellow lines connect the corresponding highs or lows on the price chart and RSI oscillator, making it easy to spot significant divergences.
Traders can use this information to anticipate market turns, optimize trade timing, and improve decision-making for scalping, day trading, and short-term swing strategies.
Free Download
Download the “rsi-divergence-indicator.ex4” MT4 indicator
Key features
- Displays divergence between price and RSI in a separate window.
- Yellow lines indicate divergence points.
- Helps spot potential trend reversals early.
- Suitable for multiple timeframes and all currency pairs.
- Can be combined with other indicators for stronger trade confirmation.
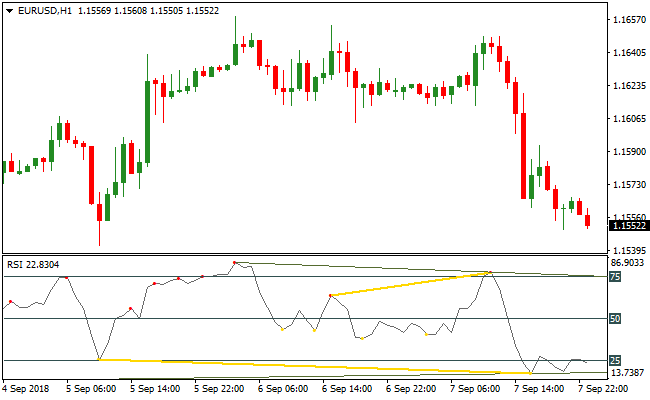
Indicator chart
The image below shows the RSI Signal Divergence indicator plotted in a separate window below the main price chart.
Divergence points appear as yellow lines between price and the RSI oscillator.
Guide to trade with the RSI Signal Divergence indicator
Buy rules
- Open a buy trade when price makes lower lows but RSI does not.
- Enter at the close of the candlestick confirming divergence.
- Look for strong divergence with multiple lows for higher probability.
- Optionally combine with a trend indicator for added confirmation.
Sell rules
- Open a sell trade when price makes higher highs but RSI does not.
- Enter at the close of the candlestick confirming divergence.
- Strong divergence signals increase trade reliability.
- Optionally combine with a trend filter for safer entries.
Stop loss
- For buy trades, place the stop just below the lowest price within the divergence zone.
- For sell trades, place the stop just above the highest price within the divergence zone.
Take profit
- Close trades when an opposite divergence appears.
- Optionally take partial profits at nearby support or resistance levels.
- Use trailing stops during strong trends to lock in gains.
- Adjust exits based on market momentum and volatility.
MT4 Strategy: RSI Divergence + Ichimoku Cloud Signals Trend Reversal Method
This MT4 day trading strategy combines the RSI Divergence Indicator and the Ichimoku Cloud Signals Indicator to identify trend reversal opportunities.
The RSI Divergence indicator highlights potential reversals by showing when price movement diverges from momentum.
The Ichimoku Cloud Signals indicator confirms the prevailing trend using a blue cloud for bullish trends and a magenta cloud for bearish trends.
Together, they allow traders to enter reversal trades with stronger confirmation.
This strategy is most effective on M15, M30, and H1 charts for intraday trading.
By combining RSI divergence with trend confirmation from the Ichimoku Cloud, traders can filter out weak signals and focus on high probability reversal setups.
It is suitable for traders looking to catch the early stages of trend changes in major and minor currency pairs.
Buy Entry Rules
- RSI Divergence shows a bullish divergence during a downtrend, indicating a potential reversal.
- The Ichimoku Cloud is blue, confirming bullish momentum.
- Enter a buy trade after divergence is confirmed and the trend aligns with the cloud.
- Place a stop loss below the recent swing low.
- Take profit when the RSI Divergence signals weaken or the Ichimoku cloud changes to magenta.
Sell Entry Rules
- RSI Divergence shows a bearish divergence during an uptrend, indicating a potential reversal.
- The Ichimoku Cloud is magenta, confirming bearish momentum.
- Enter a sell trade after divergence is confirmed and the trend aligns with the cloud.
- Place a stop loss above the recent swing high.
- Take profit when the RSI Divergence signals weaken or the Ichimoku cloud changes to blue.
Advantages
- Combines momentum divergence with trend confirmation for higher probability trades.
- Identifies early trend reversal opportunities that many traders miss.
- Works across multiple timeframes for intraday trading flexibility.
- Visual confirmation with clouds and divergence signals makes entries clear and straightforward.
- Suitable for both beginner and experienced traders seeking structured reversal strategies.
- It can be applied to various major and minor currency pairs with strong trends.
Drawbacks
- Divergence signals can sometimes give false positives during choppy markets.
- Trend confirmation may lag slightly on fast-moving price action.
- Requires patience to wait for both RSI divergence and Ichimoku cloud alignment.
- Not ideal for ultra-short-term scalping due to focus on trend reversals.
Case Study 1: USDJPY M30
During the London session, USDJPY showed a bullish RSI divergence while the price was in a downtrend.
The Ichimoku Cloud appeared blue, confirming bullish momentum.
A buy trade was entered with a stop below the recent swing low.
Price moved upward over the next hour, and the trade was closed when the cloud changed to magenta, resulting in a 32 pip gain.
The alignment of divergence and trend provided a strong reversal opportunity.
Case Study 2: EURCAD H1
EURCAD formed a bearish RSI divergence during an uptrend while the Ichimoku Cloud was magenta.
A sell trade was taken with a stop above the recent swing high.
The price declined steadily and the trade was closed when the cloud turned blue, capturing a 40 pip profit.
Using both indicators together filtered out weak signals and ensured the trade followed the emerging trend reversal.
Strategy Tips
- Focus on pairs with strong trending behavior to increase the reliability of divergence signals.
- Always wait for confirmation from the Ichimoku Cloud before entering trades based on RSI divergence.
- Place stop losses at logical swing points to minimize risk during reversal attempts.
- Take profits when either the RSI signal weakens or the Ichimoku cloud changes color to lock in gains.
- Monitor multiple pairs, but limit trades to maintain focus and discipline.
Download Now
Download the “rsi-divergence-indicator.ex4” Metatrader 4 indicator
FAQ
What types of divergence does this indicator show?
It displays both regular and hidden divergence between price and RSI.
Regular divergence signals potential reversals, while hidden divergence can indicate trend continuation.
How are divergence points displayed?
Divergence points appear as yellow lines connecting the RSI and price highs or lows in a separate window below the chart.
Summary
The RSI Signal Divergence indicator for MT4 highlights when price action and RSI move in opposite directions.
Yellow lines mark divergence points to spot reversals or trend continuation.
Traders can monitor divergence patterns to plan entries and exits more efficiently, using the indicator alone or alongside other technical tools.


