
The RSI Slowdown Buy Sell Signals forex MT4 indicator draws buy (blue) and sell (red) arrows in oversold and overbought areas when the price starts to slowdown.
For reliable buy and sell trading signals, use this indicator together with a good trend-following indicator.
This indicator is useful for scalpers, day traders, swing traders and position traders on any currency pair.
Free Download
Download the “RSI_Slowdown.mq4” MT4 indicator
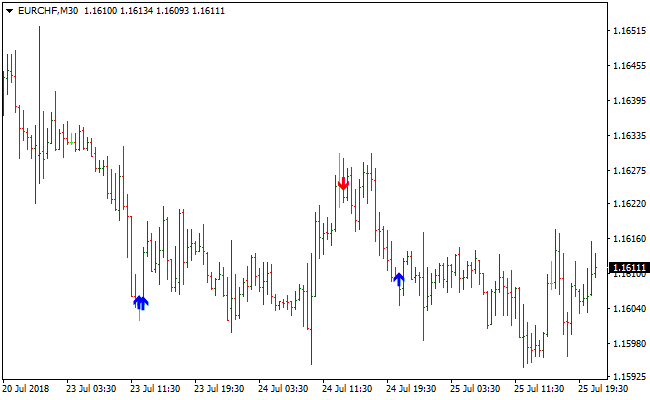
Example Chart
The EUR/CHF M30 chart below displays the RSI Slowdown Buy Sell Signals forex indicator in action.
Basic Trading Signals
Trading signals from the RSI Slowdown B/S indicator are simple to interpret and goes a follows:
Buy Trade: Open buy trade when the indicator displays a blue arrow
Sell Trade: Open sell trade when the indicator displays a red arrow
Tip: Add a longer period moving average (SMA or EMA type) to the trading chart and trade in the overall direction of the trend indicated by the moving average.
Trend up? Only trade RSI Slowdown buy signals and avoid its sell signals
Trend down? Only trade RSI Slowdown sell signals and avoid its buy signals
Download
Download the “RSI_Slowdown.mq4” Metatrader 4 indicator
MT4 Indicator Characteristics
Currency pairs: Any
Platform: Metatrader 4
Type: chart pattern indicator
Customization options: Variable (RSI Period, Signal Level Max, Signal Level Min, Seek Slowdown, Type graph, Alerts) Colors, width & Style.
Time frames: 1-Minute, 5-Minutes, 15-Minutes, 30-Minutes, 1-Hour, 4-Hours, 1-Day, 1-Week, 1-Month
Type: Divergence
Installation
Copy and paste the RSI_Slowdown.mq4 indicator into the MQL4 indicators folder of the Metatrader 4 trading platform.
You can access this folder from the top menu as follows:
File > Open Data Folder > MQL4 > Indicators (paste here)


