
About the RSI Stochastic Signals Oscillator
The RSI Stochastic Signals Oscillator for MT4 is a combined momentum indicator designed to detect overbought and oversold conditions using both RSI and Stochastic analysis.
It plots two lines in a sub window below the main chart and provides crossover signals directly on the trading chart for easier interpretation.
The oscillator ranges from 0 to 105.
Readings below 30 indicate oversold conditions, while readings above 70 indicate overbought conditions.
The blue and red oscillator lines provide the basis for trading signals: a bullish signal occurs when the blue line crosses above the red line, and a bearish signal occurs when it crosses below.
For convenience, bullish and bearish crossovers are drawn as green and red rounded arrows directly on the main chart.
This allows traders to spot potential entries at a glance without constantly switching between the oscillator window and the price chart.
Free Download
Download the “dtosc-indicator.ex4” MT4 indicator
Key Features
- Combines RSI and Stochastic indicators in a single oscillator.
- Displays bullish and bearish crossovers with arrows directly on the main chart.
- Identifies overbought and oversold conditions for entry timing.
- Oscillator range from 0 to 105 with default 30/70 thresholds.
- Works on all timeframes and currency pairs for trend-aligned trading.
Indicator Chart
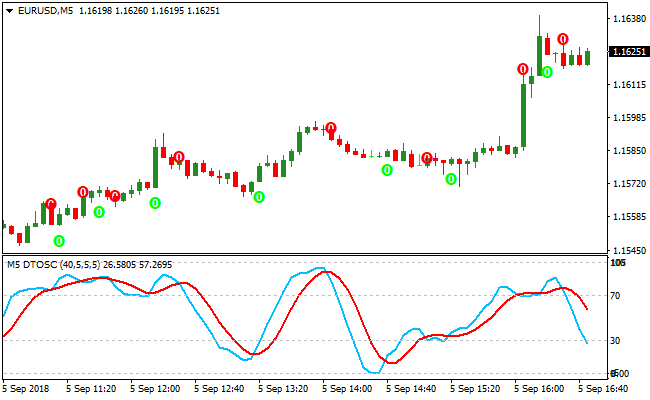
The image below shows the RSI Stochastic Signals Oscillator in a sub window below the main price chart.
Green and red arrows indicate bullish and bearish crossovers on the main chart.
The blue and red oscillator lines track momentum and highlight overbought or oversold conditions, helping traders spot entry opportunities in the direction of the overall trend.
Guide to Trade with RSI Stochastic Signals Oscillator
Buy Rules
- Confirm the overall trend is up using a trend following indicator.
- Wait for the blue oscillator line to cross above the red line near the 0–30 level.
- Enter a buy trade when a green rounded arrow appears on the chart.
- Avoid buy trades if the crossover occurs in overbought conditions or against the trend.
Sell Rules
- Confirm the overall trend is down using a trend following indicator.
- Wait for the blue oscillator line to cross below the red line near the 70–100 level.
- Enter a sell trade when a red rounded arrow appears on the chart.
- Avoid sell trades if the crossover occurs in oversold conditions or against the trend.
Stop Loss
- Place the stop just beyond the recent swing in the opposite direction.
- Use a few pips buffer to avoid noise triggers.
- Adjust the stop if the trend strengthens in your favor.
Take Profit
- Close the trade if the oscillator signals an opposite crossover against the trade direction.
- Take partial profits at nearby support or resistance levels for safer exits.
- Let trades run if higher timeframe trends confirm the trade direction.
RSI Stochastic Signals and Chimp Scalper MT4 Scalping Strategy
This MT4 scalping strategy combines the entry precision of the RSI Stochastic Signals Oscillator MT4 Forex Indicator with the trend confirmation of the Chimp Scalper Oscillator MT4 Forex Indicator.
The strategy is designed for quick, short-term trades and works best on M1 and M5 charts.
It is suitable for traders who want a structured approach for high-probability scalping setups.
The Chimp Scalper oscillator displays a histogram to confirm the trend.
A green histogram above zero indicates a bullish trend and suggests looking for buy opportunities.
A red histogram below zero indicates a bearish trend and suggests looking for sell opportunities.
The RSI Stochastic Signals Oscillator provides precise entry points using rounded arrows, with green arrows signaling buy opportunities and red arrows signaling sell opportunities.
This combination allows traders to enter trades with confidence while remaining aligned with the dominant trend.
The strategy is ideal for major forex pairs and gold during active sessions with clear momentum.
Buy Entry Rules
- The Chimp Scalper histogram must be green and above zero, confirming bullish momentum.
- Open the chart of the selected pair and wait for a green rounded arrow from the RSI Stochastic Signals Oscillator.
- Enter a buy trade at the close of the candle where the green arrow appears.
- Place the stop loss below the most recent swing low or minor support level.
- Keep the buy trade open while the Chimp Scalper histogram remains green above zero.
- Close the buy trade immediately when the histogram reverses and crosses below zero.
Sell Entry Rules
- The Chimp Scalper histogram must be red and below zero, confirming bearish momentum.
- Open the chart of the selected pair and wait for a red rounded arrow from the RSI Stochastic Signals Oscillator.
- Enter a sell trade at the close of the candle where the red arrow appears.
- Place the stop loss above the most recent swing high or minor resistance level.
- Keep the sell trade open while the Chimp Scalper histogram remains red below zero.
- Close the sell trade immediately when the histogram reverses and crosses above zero.
Advantages
- Combines trend confirmation with precise entry signals for higher probability trades.
- Works well for scalping on M1 and M5 charts during active trading sessions.
- Reduces the risk of countertrend entries by using the Chimp Scalper histogram as a filter.
- It can be applied to multiple currency pairs and gold with consistent rules.
Drawbacks
- Less effective in ranging or low volatility markets.
- Requires active screen monitoring for quick execution.
- Histogram reversals can result in premature exits during minor pullbacks.
- Overtrading can occur if multiple arrows appear during choppy conditions.
Case Study 1
On AUDUSD M1 during the London session, the Chimp Scalper histogram was green above zero, confirming a bullish trend.
A green rounded arrow from the RSI Stochastic Signals Oscillator appeared near a minor support level.
A buy trade was entered and held while the histogram stayed above zero.
The histogram later crossed below zero and the trade was closed, capturing a strong intraday upward move.
Case Study 2
On EURJPY M5 during the New York session, the Chimp Scalper histogram was red below zero, confirming a bearish trend.
A red rounded arrow appeared from the RSI Stochastic Signals Oscillator after a small pullback.
A sell trade was opened and maintained while the histogram remained below zero.
When the histogram crossed above zero, the trade was closed, locking in a profitable intraday downward move.
Strategy Tips
- Trade only in the direction of the Chimp Scalper histogram to increase probability of success.
- Wait for clear arrow signals from the RSI Stochastic Signals Oscillator before entering trades.
- Focus on major currency pairs with good volatility for faster and more reliable scalping.
- Avoid trading during low liquidity periods or around major news releases.
- Monitor histogram behavior closely for timely exits and avoid holding trades against momentum.
- Use nearby support and resistance levels for smarter stop placement and safer trade management.
Download Now
Download the “dtosc-indicator.ex4” Metatrader 4 indicator
FAQ
What levels indicate overbought or oversold conditions?
Readings below 30 are considered oversold, while readings above 70 are considered overbought.
These thresholds help traders time entries in line with momentum.
How are the arrows generated on the main chart?
Green arrows appear when the blue oscillator crosses above the red line, signaling bullish momentum.
Red arrows appear when the blue line crosses below the red line, signaling bearish momentum.
Can this indicator be used alone for trading?
While crossovers provide signals, combining them with trend confirmation or other technical indicators improves reliability and reduces false signals.
Summary
The RSI Stochastic Signals Oscillator is a practical momentum tool that combines RSI and Stochastic in one indicator.
By providing clear crossover signals on the chart, it helps traders spot high probability entries in line with the overall trend.
When paired with trend analysis, this indicator can streamline entry timing and improve trading efficiency.


