About the RSI Trend Scalper Indicator
The RSI Trend Scalper for MT5 is a scalping indicator that uses RSI overbought and oversold levels to generate trading signals.
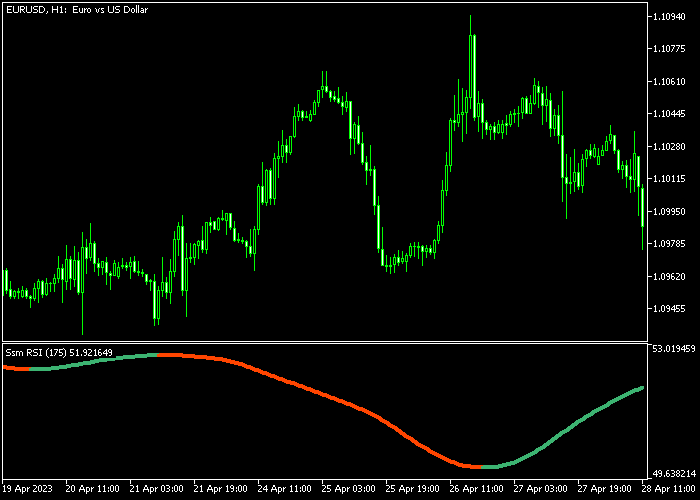
The indicator appears in a separate window below the main price area as a bi-colored line, providing visual cues for potential entries.
To improve accuracy, the system aligns trades with the overall market trend.
In an uptrend, traders focus only on green signals, while in a downtrend, red signals are prioritized.
This approach helps avoid counter-trend trades and reduces the likelihood of false entries.
The indicator is best used during high-activity sessions such as London and New York, when market volatility and trend movements offer the most trading opportunities.
Settings such as RSI period, applied price, colors, and style can be customized to suit different strategies and timeframes.
Free Download
Key Features
- RSI-based scalping indicator showing overbought and oversold conditions.
- Bi-colored signal line: green for bullish, red for bearish.
- Trades are aligned with the overall trend to increase accuracy.
- Customizable RSI period, applied price, line colors, and style.
- Optimized for London and New York trading sessions.
- Suitable for scalping strategies on multiple timeframes.
Indicator Chart
The RSI Trend Scalper indicator appears in a separate window below the main price area as a green or red line.
The color of the line indicates potential buy or sell opportunities in alignment with the current trend.
Traders observe the line color in combination with the trend direction to determine when to enter long or short positions, helping filter trades that go against the dominant market movement.

Guide to Trade with RSI Trend Scalper
Buy Rules
- Confirm the overall market trend is upward.
- Wait for the green signal line to appear in the indicator window.
- Enter a buy position once the signal aligns with the trend.
- Monitor price action and maintain the trade as long as the green line remains active.
Sell Rules
- Confirm the overall market trend is downward.
- Wait for the red signal line to appear in the indicator window.
- Enter a sell position once the signal aligns with the trend.
- Monitor price action and maintain the trade as long as the red line remains active.
Stop Loss
- Place stop loss slightly below the most recent support for buy trades.
- Place stop loss slightly above the most recent resistance for sell trades.
- Maintain consistent risk per trade to protect capital.
Take Profit
- Close all buy trades when the green line switches to red.
- Close all sell trades when the red line switches to green.
- Optionally, combine line color changes with nearby support or resistance levels for more precise exits.
MT5 RSI Trend Scalper Indicator Forex Strategy
This scalping strategy combines the RSI Trend Scalper Indicator with the Zero Lag Hull Moving Average Indicator to create a fast and clean trend-following system.
Hull-based moving averages react quickly to trend changes, making them useful for scalping and intraday trading.
When the line is green, it confirms bullish conditions, while violet indicates bearish pressure.
The RSI Trend Scalper indicator provides precise entry signals based on momentum shifts.
A green signal line indicates a buy entry, while a red signal line indicates a sell entry.
This strategy works best on M1, M5, and M15 charts during London and New York sessions.
It focuses on capturing short moves in the direction of the main trend with quick entries and exits.
Buy Entry Rules
- Confirm that the Zero Lag Hull Moving Average line is green, indicating bullish trend direction.
- Wait for the RSI Trend Scalper line to turn green.
- Enter a buy trade at the close of the signal candle.
- Place a stop loss below the most recent swing low or below a minor consolidation zone.
- Close the trade when the RSI line turns red or when the Hull line turns violet.
Sell Entry Rules
- Confirm that the Zero Lag Hull Moving Average line is violet, indicating bearish trend direction.
- Wait for the RSI Trend Scalper line to turn red.
- Enter a sell trade at the close of the signal candle.
- Set the stop loss above the most recent swing high or above a recent rejection area.
- Close the trade when the RSI line turns green or when the Hull line turns green.
Case Study 1: EURUSD M5 London Session Buy Trade
On EURUSD M5 during the London session, the Zero Lag Hull line turned green and followed price upward, confirming bullish momentum.
After a small retracement, the RSI Trend Scalper line turned green, giving a buy signal.
A buy trade was opened at the close of the signal candle.
The stop loss was placed below a recent intraday support zone where price previously reacted.
The trade was closed when the RSI line turned red, showing that momentum had weakened and the short-term bullish move was ending.
Case Study 2: GBPJPY M15 New York Session Sell Trade
On GBPJPY M15 during the New York session, the Zero Lag Hull line turned violet and remained above price, confirming bearish conditions.
A red RSI Trend Scalper signal appeared during a small upward pullback, triggering a sell entry.
A sell trade was opened at the close of the signal candle.
The stop loss was placed above a recent resistance area where price previously failed to break higher.
The trade was closed when the RSI line turned green, indicating that selling pressure was fading and a reversal could form.
Download Now
FAQ
Can this indicator be used on any timeframe?
Yes. The RSI Trend Scalper works on multiple timeframes, but it is optimized for short-term scalping on active charts.
Does it work in all trading sessions?
It performs best during the London and New York sessions when market volatility is higher, producing more reliable trend-based signals.
Can the indicator settings be customized?
Yes. Traders can adjust the RSI period, applied price, line colors, and style to suit different currency pairs and trading strategies.
Is it suitable for counter-trend trading?
No. The indicator is designed to follow the overall trend. Trades should only be taken in the direction indicated by the trend to reduce false signals.
Summary
The RSI Trend Scalper indicator provides trend-aligned RSI signals for scalping strategies.
Its bi-colored line helps traders identify bullish or bearish setups in accordance with the market trend.
By focusing on trend-aligned signals, traders can reduce counter-trend entries and increase the probability of successful trades.
Customizable settings and session optimization make it a flexible tool for active scalpers seeking precise entry and exit timing.


