
About the RSI with Bollinger Bands Indicator
The RSI with Bollinger Bands trend reversal indicator for MT4 combines two well-known technical tools to help traders identify potential turning points in the market.
By blending momentum analysis from RSI with volatility-based Bollinger Bands, the indicator focuses on detecting early trend reversals.
After installation, the indicator is displayed in a separate window below the main price chart.
It uses colored arrows to highlight possible buy and sell opportunities, making signals easy to recognize without additional calculations.
This indicator works on any currency pair and time frame, giving traders flexibility across different market conditions.
It is particularly effective for scalping when used during the European and American trading sessions, where volatility and liquidity are higher.
Free Download
Download the “RSI_Bands_v1.ex4” MT4 indicator
Key Features
- Combines RSI momentum with Bollinger Bands volatility.
- Identifies early trend reversal opportunities.
- Displays clear buy and sell arrows in a sub-window.
- Green arrows signal bullish reversals.
- Red arrows signal bearish reversals.
- Suitable for all currency pairs and time frames.
- Effective for scalping on M1, M5, and M15 charts.
Indicator Chart
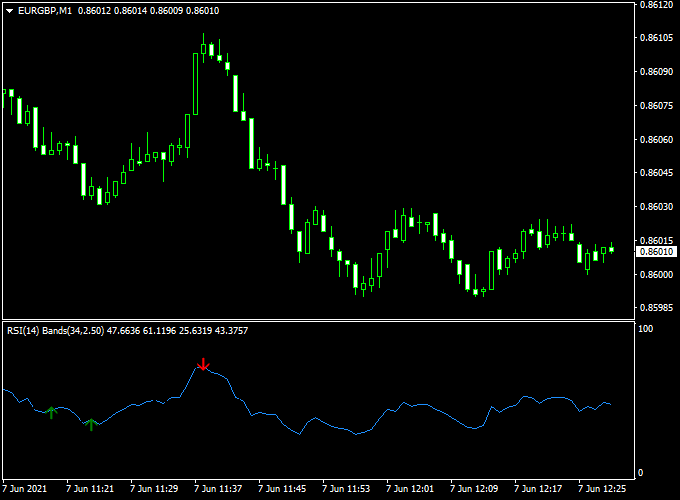
The chart shows the RSI with Bollinger Bands indicator plotted beneath the main price chart.
Buy and sell arrows appear directly on the indicator window.
These arrows help traders spot potential reversal zones, allowing them to anticipate changes in trend direction rather than reacting late.
Guide to Trade with RSI with Bollinger Bands
Buy Rules
- Wait for a green reversal arrow to appear.
- Confirm that price is reacting from an extended bearish move.
- Open a buy trade at the close of the signal candle.
Sell Rules
- Wait for a red reversal arrow to appear.
- Confirm that price is reacting from an extended bullish move.
- Open a sell trade at the close of the signal candle.
Stop Loss
- Place the stop loss beyond the most recent swing level.
- Allow slightly wider stops during high-volatility sessions.
Take Profit
- Close the trade near the next key support or resistance area.
- Alternatively, exit when an opposite arrow appears.
RSI with Bollinger Bands Indicator + Super Forex Trend MT4 Strategy
This MT4 Forex strategy combines the RSI with Bollinger Bands Trend Reversal Indicator and the Super Forex Trend Indicator.
The RSI with Bollinger Bands indicator gives green arrows for buy signals and red arrows for sell signals.
The Super Forex Trend indicator confirms trend direction: price above the orange line indicates a bullish trend, and price below indicates a bearish trend.
Combining these indicators allows traders to enter trades in the direction of the prevailing trend while timing reversals for better entries, suitable for M15 and H1 charts for intraday trading.
Buy Entry Rules
- Confirm that the price is above the orange line of the Super Forex Trend indicator, indicating a bullish trend.
- Enter a buy trade when the RSI with the Bollinger Bands indicator shows a green arrow.
- Place a stop loss a few pips below the recent swing low or below the signal candle.
- Set a take profit target based on a risk-reward ratio of at least 1:2 or exit when a red arrow appears or price closes below the orange line.
Sell Entry Rules
- Confirm that the price is below the orange line of the Super Forex Trend indicator, indicating a bearish trend.
- Enter a sell trade when the RSI with the Bollinger Bands indicator shows a red arrow.
- Place a stop loss a few pips above the recent swing high or above the signal candle.
- Set a take profit target based on a risk-reward ratio of at least 1:2 or exit when a green arrow appears or price closes above the orange line.
Advantages
- Helps traders enter in the direction of the prevailing trend while also timing potential reversals for better entries.
- Effective for intraday trading on multiple timeframes, offering flexibility for both M15 and H1 charts.
- Combining trend confirmation with reversal signals reduces the likelihood of trading against the market.
- It can be used across major currency pairs with strong liquidity, enhancing the reliability of signals.
Drawbacks
- Trend signals may lag slightly, especially during sudden reversals or high-impact news events.
- Scalpers and intraday traders need to monitor charts actively, which may be time-consuming.
- Small stop losses required on intraday charts can be triggered by minor price fluctuations, affecting risk-reward ratios.
Case Study 1: EURUSD M15 Chart
The price was above the orange Super Forex Trend line, indicating a bullish trend.
A green arrow appeared from the RSI with the Bollinger Bands indicator at 1.1020.
A buy trade was entered at 1.1020 with a stop at 1.1005.
Price moved to 1.1050 (30 pips) before a red arrow appeared, prompting exit.
Case Study 2: GBPUSD H1 Chart
The price was below the orange Super Forex Trend line, indicating a bearish trend.
A red arrow appeared from the RSI with the Bollinger Bands indicator at 1.2645.
A sell trade was entered at 1.2645 with a stop at 1.2660.
Price dropped to 1.2605 (40 pips) before a green arrow appeared, and price closed above the orange line, signalling exit.
Strategy Tips
- Use multiple time frame analysis to confirm the trend on higher time frames before entering on M15 or H1 charts.
- Prioritize trades where the green or red arrow appears near key support or resistance levels for higher probability setups.
- Avoid trading when the price is too far extended from the orange Super Forex Trend line to reduce the risk of reversal.
- Track volatility and avoid trades during low-volume sessions to minimize false signals.
- Consider waiting for candle close confirmation after the arrow appears to reduce premature entries.
- Maintain a trading journal to track performance and identify which currency pairs and sessions are most profitable.
Download Now
Download the “RSI_Bands_v1.ex4” Metatrader 4 indicator
FAQ
Why does the indicator use both RSI and Bollinger Bands?
RSI measures momentum extremes, while Bollinger Bands track volatility.
Combining both helps filter weaker signals and focus on meaningful reversals.
Is this indicator better for reversals or trends?
It is primarily designed for spotting reversals, but it can also be used to catch early trend continuation after pullbacks.
Can it be used on higher time frames?
Yes. While it performs well for scalping, higher time frames often produce fewer but more reliable reversal signals.
Does market session matter?
Yes. Signals tend to be more effective during the London and New York sessions due to increased liquidity and price movement.
Summary
The RSI with Bollinger Bands Trend Reversal indicator for MT4 helps traders anticipate shifts in market direction using a proven combination of momentum and volatility analysis.
Its arrow-based signals make reversal trading more accessible.
The indicator adapts well to different markets and time frames.
With disciplined risk management, it can become a valuable tool for reversal-focused strategies.


