About the RSI with Trend Catcher Signal
The RSI with Trend Catcher Signal for MT4 is a practical tool that takes the guesswork out of reading market momentum.
Instead of trying to interpret complex overlapping indicators, this tool combines the Relative Strength Index with a trend-following algorithm and displays the result as a simple color-coded line.
When the trend is bullish and momentum is rising, the line turns green; when the bears take control, the line turns red.
It is a beginner-friendly trading indicator that helps you spot the exact moment a trend starts to gain speed.
Free Download
Download the “Rsi with trend catcher signal.mq4” indicator for MT4
Key Features
- The indicator appears in a bottom chart window in the form of an easy-to-follow buy/sell technical oscillator.
- It merges the sensitivity of the RSI with the stability of the Trend Catcher algorithm for smoother signals.
- The color-coded output provides an instant visual confirmation of the current market bias.
- It provides clear entry points at the very start of a color change to maximize profit potential.
Indicator Chart
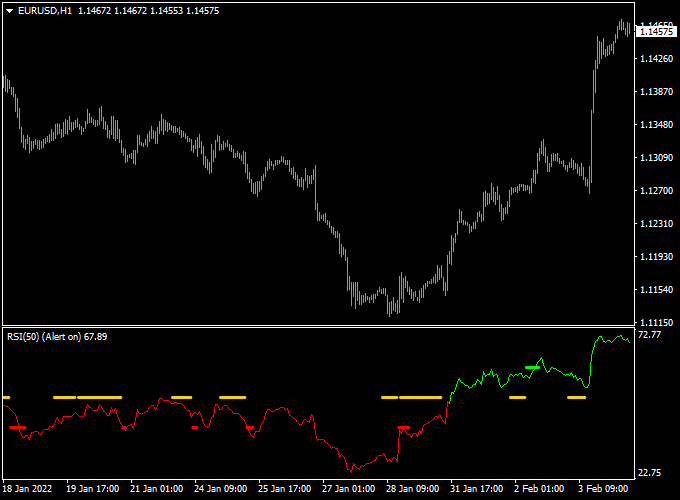
The RSI with Trend Catcher Signal indicator chart features a dedicated sub-window below the price action.
The oscillator line stays green during bullish phases and switches to red when the momentum turns bearish.
By keeping the main chart clean, traders can focus on price levels while the oscillator provides the underlying trend confirmation.

Guide to Trade with RSI with Trend Catcher Signal
To achieve the best results with this tool, follow these specific trading rules.
Buy Rules
- Watch the oscillator window for the signal line to change from red to green.
- The start of the green signal line is the buy entry signal.
- Open a buy position at the opening of the next candle after the color shift.
- Confirm that the price is currently trading above a recent swing low or support level.
Sell Rules
- Monitor the oscillator window for the signal line to change from green to red.
- The start of the red signal line is the sell entry signal.
- Open a sell position at the opening of the next candle after the color shift.
- Verify that the market is showing downward pressure on the main price chart.
Stop Loss
- For buy trades, place the stop loss a few pips below the most recent local support.
- For sell trades, place the stop loss a few pips above the most recent local resistance.
- Always use a protective stop to manage your risk on every trade.
Take Profit
- Exit the trade as soon as the oscillator line changes back to the opposite color.
- Alternatively, target a fixed risk-to-reward ratio of at least 1:2.
- You can also close the position when price reaches a major psychological level.
RSI‑Trend‑Catcher + EMA Trend Forex Intraday Strategy
This intraday strategy pairs the RSI with Trend Catcher Signal Indicator MT4 and the EMA Trend Forex Indicator MT4.
It is designed for traders looking to enter short to medium intraday moves (for example, on 15‑minute, 30-minute, or 1‑hour charts) with a trend‑based filter and a precise entry trigger.
How It Works
The RSI‑Trend‑Catcher indicator displays a signal line that changes color: when the line turns green, it marks the start of a buy entry opportunity; when the line turns red, it marks the start of a sell entry opportunity.
Meanwhile, the EMA Trend indicator tracks multiple exponential moving averages (commonly 4 EMAs) and indicates trend direction:
When the price closes above all four EMAs, this suggests a bullish trend; when the price closes below all four EMAs, this suggests a bearish trend.
Using both together means you only enter when both a fresh signal appears and the broader trend agrees.
Buy Entry Rules
- The RSI Trend Catcher indicator displays a green signal line start (entry trigger).
- The price closes above all 4 EMAs (EMA Trend indicator), confirming a bullish trend.
- Enter a buy trade at the open of the next candle following both conditions.
- Stop loss: place below the most recent swing low, for example, 15‑30 pips, depending on pair and timeframe.
- Take profit: Fixed target of approximately 2× risk (e.g., risk 20 pips → target 40 pips).
- Or exit when the RSI‑Trend‑Catcher line turns red or the price closes below all EMAs (trend change). Choose whichever happens first.
Sell Entry Rules
- The RSI‑Trend‑Catcher indicator displays a red signal line start.
- The price closes below all 4 EMAs, confirming a bearish trend.
- Enter a sell trade at the opening of the next candle after both conditions are met.
- Stop loss: place above the recent swing high (or above the candle that triggered). For example, 15‑30 pips depending on pair/timeframe.
- Take profit: Fixed target approximately 2× risk.
- OR exit when the RSI line turns green or price closes above all EMAs — whichever happens first.
Advantages
- Combines precise entry trigger (RSI‑Trend‑Catcher) with a robust trend filter (EMA Trend) so you trade with the trend, not against it.
- Entry signals are clearly defined, reducing hesitation or ambiguity.
- The optional exit rule (trend change or fixed target) allows flexibility — you capture strong moves but limit risk when the trend reverses.
- Suitable for intraday charts (15 m, 30 m, 1 h), so you can execute multiple trades during active sessions.
Drawbacks
- Requires quick decisions and monitoring; missed execution reduces effectiveness.
- Fixed targets may limit profits in strong trends.
- Sudden news events can trigger stop losses or reversals.
Case Study 1 – EUR/USD 30‑Minute Chart
On the EUR/USD 30‑minute chart, the RSI‑Trend‑Catcher displayed the green line starting at around 1.1050, and concurrently, the price had just closed above all four EMAs.
A buy trade was entered at 1.1052 with a stop loss at 1.1032 (20 pips risk).
Using a take profit (2× risk), the target was set at 1.1092 (40 pips).
The trade reached the target within 3 hours, capturing 40 pips.
Case Study 2 – GBP/CHF 1‑Hour Chart
On GBP/CHF, the trend had been bearish.
The RSI‑Trend‑Catcher turned red at about 1.2340 while the price closed below all four EMAs, confirming a downtrend.
A sell trade was opened at 1.2338 with a stop loss at 1.2368 (30 pips risk).
The trade was monitored and exited when the RSI line turned green (indicating signal‑change) rather than waiting for the full target.
The exit occurred at 1.2298, capturing 40 pips (1.33× risk) in about 4 hours.
Strategy Tips
- Trade liquid pairs with tight spreads.
- Focus on high-volume sessions (London/New York).
- Avoid trades before major news releases.
- Adjust stop-loss and take-profit to match volatility.
- Keep a trade journal to track performance.
- Skip trades if EMAs are flat or the market is ranging.
Download Now
Download the “Rsi with trend catcher signal.mq4” indicator for Metatrader 4
FAQ
What makes this indicator beginner-friendly?
Many indicators require you to look for specific values or complex patterns, but the RSI with Trend Catcher Signal uses simple color changes.
If the line is green, you look for buys; if it is red, you look for sells.
This simplicity helps new traders avoid the “analysis paralysis” that often comes with more complicated systems.
Can I change the sensitivity of the Trend Catcher?
Yes, the indicator settings allow you to adjust the input periods.
Increasing the period will result in fewer, more stable signals for long-term trends.
Decreasing the period makes the indicator more reactive, which is often preferred by scalpers looking for quick intraday moves.
Summary
The RSI with Trend Catcher Signal for MT4 is an effective technical tool that helps traders stay on the right side of market momentum.
It offers a clear visual representation of when a trend is gaining strength or starting to fade.
This indicator assists in maintaining a professional edge by identifying high-probability entry points that signal trend transitions.
Using it consistently helps in building a more disciplined approach to entries and exits.


