About the RSX Forex Oscillator
The RSX Forex Oscillator for MT4 is a practical tool that takes the guesswork out of identifying market extremes.
Instead of dealing with the jagged movements of a classic RSI, this system uses a more refined calculation to deliver a fluid signal line.
The RSX Forex Oscillator for Metatrader 4 is a technical indicator that delivers overbought and oversold trading signals on the chart.
It helps you recognize when a trend has reached its limit, allowing you to prepare for a bounce or a full trend change.
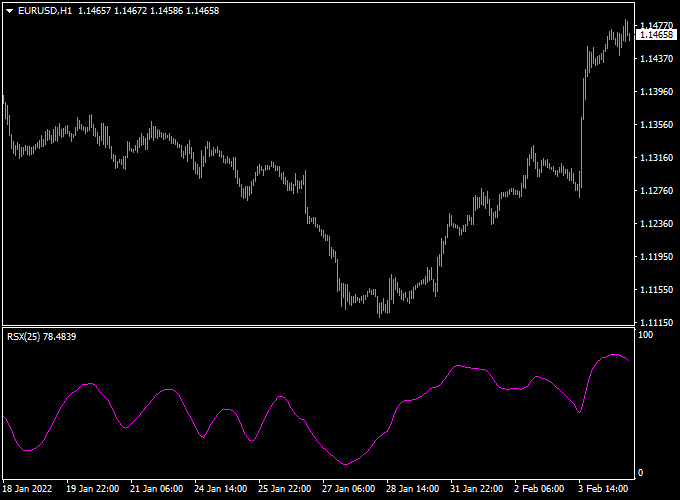
The indicator pops up in a separate MT4 chart window as a purple colored signal line that oscillates between 0 and 100.
Because it is highly responsive yet smooth, it allows you to stay in winning trades longer without being shaken out by minor price wiggles.
Free Download
Download the “Rsx oscillator.mq4” indicator for MT4
Key Features
- The indicator provides a dedicated oscillator window to track momentum away from the main price candles.
- It features a fixed scale where the value 0 is oversold and 100 is overbought.
- The purple signal line uses advanced smoothing to eliminate false momentum spikes.
- The interface is designed for rapid decision-making during fast-moving market sessions.
Indicator Chart
The RSX Forex Oscillator chart displays a single purple line that moves between extreme boundaries in a sub-window.
When the line hits the bottom 0 level, it signals that the market is currently undervalued.
When the line reaches the top 100 level, it indicates that the market is overvalued.
By checking the position of the purple line, a trader can instantly judge if it is safe to enter a new position.

Guide to Trade with the RSX Forex Oscillator
To achieve the best results with this tool, follow these specific trading rules.
Buy Rules
- Monitor the oscillator window for the purple signal line to reach the bottom.
- Open a buy order when the RSX indicator reading reaches 0 and the market is in an uptrend.
- Confirm the signal with a bullish reversal candlestick pattern on the main chart.
- Ensure price is not trading directly into a major resistance level.
Sell Rules
- Watch the oscillator window for the signal line to reach the top of the scale.
- Open a sell order when the RSX indicator reading reaches 100 and the market is in a downtrend.
- Verify the signal with a bearish candle close to confirm the shift in momentum.
- Check that there is enough room for the trade to move toward the next support level.
Stop Loss
- For buy trades, place the stop loss a few pips below the most recent swing low.
- For sell trades, place the stop loss a few pips above the most recent swing high.
- Always keep your risk fixed to protect your trading capital from volatility.
Take Profit
- Exit the trade when the purple RSX line reaches the opposite extreme level.
- Alternatively, target a specific risk-to-reward ratio based on market volatility.
- You can also close the trade if the signal line starts to flatten out significantly.
RSX Oscillator + Heiken Ashi Trend Signals Forex Strategy
This MT4 trading strategy combines the smooth precision of the RSX Forex Oscillator Indicator with the visual clarity of the Heiken Ashi Trend Signals Indicator.
It is built for traders who want simple yet powerful entries that follow market momentum while filtering out price noise.
The strategy is best suited for M5 to H1 charts and works effectively in trending environments where clean entries and exits are critical.
The RSX indicator measures market strength and identifies oversold and overbought levels with greater stability than the standard RSI.
Meanwhile, the Heiken Ashi Trend Signals Indicator smooths candlestick data to show clear bullish or bearish color transitions — green for bullish conditions and orange for bearish.
Together, these tools allow traders to capture early reversals and follow trend direction with high precision.
Why This Strategy Works
Most traders lose money by entering too early during momentum shifts.
This combination solves that by using the RSX to pinpoint market exhaustion and the Heiken Ashi trend colors to confirm real direction.
The RSX gives the signal for potential reversal, while the Heiken Ashi candles confirm the trend continuation.
This creates a balance between timing and confirmation, making it ideal for intraday and swing traders alike.
Buy Entry Rules
- Open a buy order when the RSX indicator reading reaches 0, showing an oversold condition and potential bullish reversal.
- Confirm the uptrend when Heiken Ashi candles turn green, signaling a momentum shift to the upside.
- Place your stop loss a few pips below the latest swing low or the most recent orange candle.
- Take profit at 20–40 pips for short-term trades or close when RSX reaches the 70–80 zone.
Sell Entry Rules
- Open a sell order when the RSX indicator reading reaches 100, indicating the market is overbought and likely to reverse down.
- Confirm the downtrend when Heiken Ashi candles turn orange, showing bearish strength.
- Place your stop loss a few pips above the latest swing high or above the last green candle.
- Take profit at 20–40 pips for scalping or close when RSX returns to the 30 level.
Advantages
- Combines momentum, timing, and trend confirmation for high-probability setups.
- Heiken Ashi smoothing reduces false entries caused by short-term volatility.
- RSX indicator reacts faster than the traditional RSI, providing earlier reversals.
- Easy to read visually, making it beginner-friendly.
- Works across all major forex pairs and timeframes.
Drawbacks
- Delayed exits if traders rely only on candle color changes.
- RSX readings can remain at extremes during strong trends, so confirmation is key.
Example Case Study 1: EURUSD M15 Chart
On the EURUSD pair, the RSX reached 0 during a temporary dip in the London session.
Shortly after, Heiken Ashi candles switched from orange to green, confirming a new uptrend.
A buy position was entered at 1.0740 with a stop loss at 1.0725 and a take profit at 1.0780.
Within an hour, the pair climbed steadily, hitting the profit target for +40 pips.
The smooth transition of the Heiken Ashi candles avoided early exits and allowed the trader to ride the move with confidence.
Example Case Study 2: GBPUSD M30 Chart
Later in the New York session, GBPUSD spiked upward, and the RSX reading hit 100, signaling overbought conditions.
At the same time, the Heiken Ashi candles shifted from green to orange, confirming bearish pressure.
A sell order was executed at 1.2790 with a stop loss at 1.2810 and a target at 1.2750.
Price dropped smoothly within two hours, hitting the take profit for +40 pips.
This combination perfectly timed the reversal and captured a clean profit before the next consolidation.
Strategy Tips
- Confirm the trend with Heiken Ashi candle colors — green for buy, orange for sell.
- Avoid trading when candles alternate colors rapidly; it often means sideways price action.
- Use this strategy during the London and New York sessions for higher volatility and cleaner signals.
- Always confirm higher timeframe direction before taking a trade for extra confidence.
Download Now
Download the “Rsx oscillator.mq4” indicator for Metatrader 4
FAQ
What makes the RSX different from a standard RSI indicator?
The primary difference is the smoothing algorithm used in the RSX Forex Oscillator.
While a standard RSI can be very choppy and produce many false signals in a noisy market, the RSX produces a much cleaner line.
This makes it easier to spot the actual trend and identify when momentum is truly shifting rather than just reacting to small price ticks.
Can I use the RSX for scalping on 5-minute charts?
Yes, the RSX is an excellent choice for scalping because it filters out much of the intraday noise.
Traders often look for the 0 and 100 readings during high-volume sessions like the London or New York open.
Because it is lightweight, it will update instantly on lower timeframes without lagging your platform.
How do I identify the trend direction before taking an RSX signal?
Professional traders often use a long-term moving average on the main chart to determine the trend.
If the price is above the moving average, you only look for buy signals when the RSX hits 0.
If the price is below the moving average, you only look for sell signals when the RSX hits 100.
Summary
The RSX Forex Oscillator for MT4 is an effective momentum tool that assists in determining the appropriate timing for market entries.
By offering a smoothed view of price strength, it helps you avoid the common trap of entering trades during minor pullbacks.
This tool helps traders maintain a disciplined routine by highlighting levels where the market is statistically likely to reverse.
Using this indicator allows you to filter high-risk trades that occur when momentum is fading.


