The Sidus Forex System indicator for Metatrader 4 is a good trading system that comes with simple-to-use buy/sell arrows and signal lines.
Basically, the indicator will notify traders of any trend changes by drawing buy and sell arrows on the main MT4 chart.
Buy & Sell Trade Example
- Open a buy trade when the price is trading above the two red lines and a green arrow appears on the chart.
- Open a sell trade when the price is trading below the two red lines and a red arrow appears on the chart.
The indicator works for any trade style of your preference, and it can be used as a standalone trading tool for both trade entry and exit.
The indicator works equally well on all currency pairs (majors, minors, and exotic) and shows promising results if used correctly.
Free Download
Download the “sidus.mq4” indicator for MT4
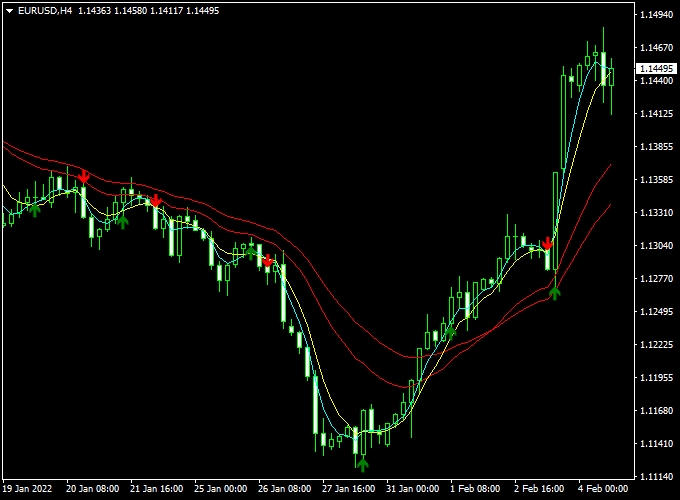
Indicator Chart (EUR/USD H4)
The picture below shows the Sidus Forex System mt4 indicator in action on the trading chart.

Trading Tips:
Feel free to use your own favorite trade entry, stop loss and take profit strategy when trading with the Sidus Forex System indicator.
As always, trade in agreement with the overall trend and practice on a demo account first until you fully understand this indicator.
Please note that even the best trading indicator cannot yield a 100% win rate over long periods.
Indicator Specifications & Inputs:
Trading Platform: Developed for Metatrader 4 (MT4)
Currency pairs: Works for any pair
Time frames: Works for any time frame
Trade Style: Works for scalping, day trading and swing trading
Input Parameters: Variable (inputs tab), color settings & style
Indicator type: Forex system
Does the indicator repaint? No.
Sidus Forex System + Four Time Frames ASCTrend Day Trading Strategy
This day-trading strategy combines the Sidus Forex System Indicator MT4 with the Four Time Frames ASCTrend Indicator MT4.
The Sidus Forex System helps identify precise entry points using two red moving average lines and colored arrows: green for buy signals and red for sell signals.
The ASCTrend Indicator confirms the overall trend direction across four time frames, with all blue bars signaling a strong uptrend and all red bars indicating a strong downtrend.
This strategy is designed for intraday traders who monitor the charts and execute trades during high-liquidity sessions, such as London and New York.
It works well on M5, M15, and M30 time frames and is suitable for major currency pairs such as EURUSD, GBPUSD, and USDJPY.
By combining entry precision with multi-timeframe trend confirmation, traders can take advantage of strong intraday moves.
Buy Entry Rules
- Check that all four trend bars on the ASCTrend Indicator are blue, confirming a strong uptrend.
- Ensure the price is trading above both moving average red lines on the Sidus Forex System indicator.
- Wait for a green arrow to appear on the Sidus Forex System chart.
- Enter a buy trade at the close of the candle with the green arrow.
- Place a stop loss just below the lower red line or recent swing low.
- Take profit after 25–40 pips, or use a trailing stop as the trend continues.
Sell Entry Rules
- Check that all four trend bars on the ASCTrend Indicator are red, indicating a strong downtrend.
- Ensure the price is trading below both red lines on the Sidus Forex System indicator.
- Wait for a red arrow to appear on the Sidus Forex System chart.
- Enter a sell trade at the close of the candle with the red arrow.
- Place a stop loss just above the upper red line or recent swing high.
- Take profit after 25–40 pips, or trail the stop as the trend continues downward.
Advantages
- Combines precise entry signals from Sidus with strong trend confirmation from ASCTrend.
- Helps avoid counter-trend trades and reduces false entries.
- Effective for fast intraday trades during volatile sessions.
- Works on multiple time frames for flexible trading strategies.
Drawbacks
- Signals may lag during sudden reversals, potentially missing the initial part of the move.
- Requires continuous monitoring of the charts to capture intraday entries.
- Not suitable for sideways or low-volatility markets where arrows and trend bars may conflict.
- Spread and slippage can affect small intraday profits.
Case Study 1: EURUSD M15 – London Session
During the London session, EURUSD showed all blue ASCTrend bars on M15, indicating a strong uptrend.
The price was trading above both red Sidus lines, and a green arrow appeared at 1.0920.
A buy trade was placed with a 12-pip stop loss.
Within 30 minutes, the pair reached 1.0955, yielding a 35-pip profit.
The alignment of the multi-timeframe trend and Sidus entry confirmed a high-probability setup.
Case Study 2: GBPUSD M5 – New York Session
GBPUSD displayed all red ASCTrend bars on M5, showing a strong downtrend.
The price was below both Sidus MA red lines, and a red arrow appeared at 1.2785.
A sell trade was executed with a 15-pip stop.
The price dropped to 1.2750 within 40 minutes, resulting in a 35-pip gain.
This trade demonstrated how the strategy captures strong intraday moves when both indicators align.
Strategy Tips
- Focus on major trading sessions to ensure high liquidity and strong trend movements.
- Do not enter trades if trend bars and Sidus arrows are not aligned across the same time frame.
- Use additional support/resistance levels to filter entries and improve risk management.
- Consider trading only pairs with low spreads to maximize scalping profits.
- Use trailing stops for extended trends to lock in profits while letting winners run.
This day-trading strategy provides precise entries with strong trend alignment, allowing traders to capitalize on short-term market movements while managing risk effectively.


