
About the Squeeze Trend Oscillator Indicator
The Squeeze Trend Oscillator Indicator for MT4 is a dynamic momentum-based tool designed to help traders identify the direction and strength of the prevailing market trend.
It functions by calculating price fluctuations and displaying them as a color-coded histogram that fluctuates around a central zero level.
When the histogram bars are positioned above the zero mark and colored blue, the market is experiencing upward momentum.
Conversely, when the bars are below the zero mark and colored red, the market is under bearish pressure.
By using the Squeeze Trend Oscillator Indicator, you can effectively filter out market noise and focus on high-probability setups.
The “squeeze” element of the tool helps identify periods where momentum is building, providing a clear signal for potential trend entries.
Free Download
Download the “bbsqueeze-dark.mq4” MT4 indicator
Key Features
- Features a colored histogram system that identifies trend direction and momentum shifts instantly.
- Uses a zero-level threshold to define a clear bullish or bearish market environment.
- Displays blue bars for upward trends and red bars for downward trends for easy visual interpretation.
- Functions as a robust momentum filter to reduce the risk of trading against the primary trend.
Indicator Chart
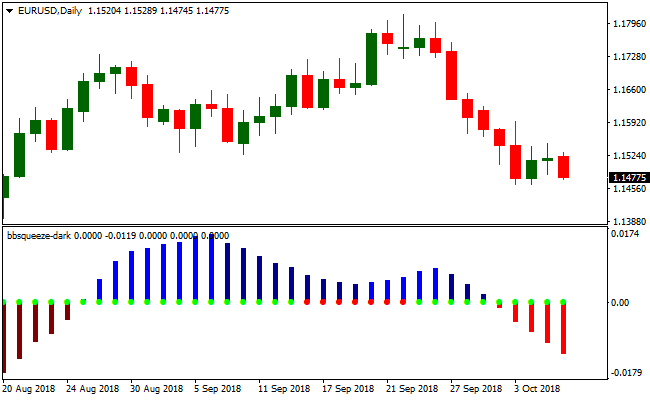
The Squeeze Trend Oscillator Indicator appears in a sub-window below the main price candles.
It consists of vertical bars that oscillate above and below a central zero line.
Blue histograms aligned above the zero mark indicate a bullish phase, while red histograms aligned below the mark indicate a bearish phase.
Guide to Trade with the Squeeze Trend Oscillator Indicator
Buy Rules
- First, ensure that the overall market trend is bullish using a long-term moving average or price action analysis.
- Monitor the Squeeze Trend Oscillator Indicator for the histogram bars to turn blue above the zero level.
- Open a long position as soon as the blue histogram is confirmed on a closed candle.
- Verify that the price action on the main chart supports the bullish momentum before entry.
Sell Rules
- Determine that the broader market trend is bearish through technical analysis or higher timeframe observation.
- Wait for the histograms of the Squeeze Trend Oscillator Indicator to turn red below the zero level.
- Execute a short trade once the red bar signal is fully established.
- Confirm that the bearish momentum is sustained by lower highs or a breakout of a support zone.
Stop Loss
- For buy trades, place the stop loss a few pips below the most recent swing low.
- For sell trades, position the stop loss slightly above the nearest swing high.
- Adjust your stop levels to account for current market volatility and avoid being stopped out by minor spikes.
Take Profit
- Set your take profit at the next major technical resistance or support level.
- Aim for a target that offers at least a 1:2 reward-to-risk ratio to maintain long-term profitability.
BDFX Trender Indicator + Visual MACD MT4 Forex Strategy
This strategy uses the BDFX Trender MT4 histogram as a momentum trigger and the Visual MACD MT4 cloud with dotted lines as a trend filter.
The idea is to enter trades only when momentum from the BDFX Trender and trend direction from the Visual MACD are aligned.
The approach works on intraday timeframes such as 15-minute, 30-minute, and 1-hour charts and is intended for traders who prefer clear signals and controlled risk.
The strategy performs best on currency pairs with decent volatility and where momentum signals tend to carry the price further.
It is more effective when the market is not flat or choppy.
For best results, avoid heavy news periods and use proper risk management.
Buy Entry Rules
- Wait until the BDFX Trender histogram turns blue, indicating bullish momentum above zero.
- Confirm that the Visual MACD cloud shows a bullish trend with a green dotted line.
- Once both conditions are met, enter a buy trade.
- Place a stop loss below the most recent swing low.
- Set take profit at the next resistance level or exit when the histogram turns red.
Sell Entry Rules
- Wait until the BDFX Trender histogram turns red, indicating bearish momentum below zero.
- Confirm that the Visual MACD cloud shows a bearish trend with a red dotted line.
- Once both conditions are met, enter a sell trade.
- Place a stop loss above the most recent swing high.
- Set take profit at the next support level or exit when the histogram turns blue.
Advantages
- Combining momentum from the histogram and trend from the cloud reduces false signals.
- Flexible on multiple timeframes such as 15-minute, 30-minute, and 1-hour charts.
- Stop loss based on recent swing points keeps risk consistent and manageable.
Drawbacks
- It requires constant attention on the chart, making it less suitable for traders who cannot monitor trades frequently.
- Whipsaw movements can trigger stop losses before the trend fully develops, especially in volatile markets.
- Settings may need adjustment for different currency pairs, which can be time-consuming.
Case Study 1
Pair EUR/USD, Timeframe 15-minute chart. BDFX Trender histogram turned blue and the Visual MACD cloud was green.
Entry at 1.0850. Recent swing low was 1.0820, stop loss set at 1.0820 for 30 pips risk.
Price moved to 1.0885 near resistance.
Histogram turned red, trade exited for 35 pips profit.
Case Study 2
Pair GBP/JPY, Timeframe 30-minute chart. The histogram turned red and the Visual MACD cloud was red.
Entry sell at 157.20. Swing high was 157.50, stop loss set at 157.50 for 30 pips risk.
Price dropped to 156.40 near support, trade closed with 80 pips profit as the histogram flipped blue.
Case Study 3
Pair AUD/USD, Timeframe 1-hour chart. The histogram turned blue and the Visual MACD cloud was green.
Entry buy at 0.6650. Recent swing low at 0.6625, stop loss set at 0.6625 for 25 pips risk.
Price moved to 0.6680.
Visual MACD cloud and histogram signaled a trend change, trade closed with 30 pips profit.
Strategy Tips
- Select pairs with moderate to high volatility and avoid low volume or erratic pairs.
- Adjust stop loss according to pair volatility. A static pip value may not suit all pairs.
- Consider partial profit taking. Close part of the position and move the stop loss to break even if the trade moves favorably.
- Backtest on historical data across several pairs and timeframes to find optimal settings for your style and risk tolerance.
Download Now
Download the “bbsqueeze-dark.mq4” Metatrader 4 indicator
FAQ
How does the Squeeze Trend Oscillator Indicator help in trend following?
The indicator acts as a momentum filter. It shows you exactly when the market is accelerating in a specific direction.
By only taking blue signals in an uptrend and red signals in a downtrend, you ensure that you are always trading in the direction of the “big money” flows, which significantly improves the probability of a successful trade.
Can I use this indicator as a standalone trading system?
While it is a powerful tool, it is highly recommended to combine the Squeeze Trend Oscillator Indicator with a longer-term trend following indicator or price action techniques.
This helps you avoid false signals that can occur during ranging markets and ensures that your entries are aligned with the broader market structure.
What does it mean when the histogram bars stay near the zero line?
When the bars are small and hovering near the zero line, it indicates a lack of momentum or a ranging market.
In this environment, it is often wiser to stay on the sidelines.
The best trades usually occur when the bars are growing in height, showing that a “squeeze” has broken and a strong trend is underway.
Summary
The Squeeze Trend Oscillator Indicator is an excellent utility for traders who want to capitalize on momentum with visual clarity.
By simplifying complex trend data into a red and blue histogram, it removes the guesswork from market analysis.
Its primary strength lies in identifying the start of new momentum waves, allowing you to join trends just as they begin to accelerate.
For the best results, use this tool to time your entries in the direction of the higher timeframe trend.
This disciplined approach will help you avoid choppy markets and focus on high-conviction moves.


