
About the Standard Deviation Channel Indicator
The Standard Deviation Channel Indicator for MT4 overlays linear regression channels onto the main price area, helping traders identify trend direction and key support and resistance zones.
The indicator draws a middle linear regression line with standard deviation lines above and below, forming a channel.
The slope of the channel indicates the trend: upward slopes suggest bullish momentum, while downward slopes indicate bearish momentum.
Traders use the upper and lower channel lines as resistance and support levels.
Price interactions with these lines provide potential entry and exit points aligned with the prevailing trend.
This indicator works well for scalpers, day traders, and swing traders who prefer trading in the direction of the trend while respecting volatility boundaries.
Free Download
Download the “StandardDeviationChannel.mq4” MT4 indicator
Key Features
- Overlay indicator showing linear regression with upper and lower standard deviation lines.
- Channel slope signals the overall trend direction.
- Upper lines act as resistance, lower lines act as support.
- Visual tool for trend-following and pullback strategies.
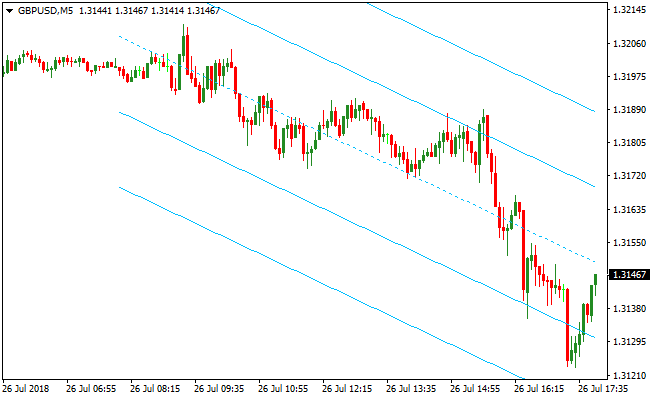
Indicator Chart
The Standard Deviation Channel Indicator is plotted directly on the main price area, showing the regression channel and its upper and lower standard deviation lines.
Traders watch the slope of the channel to identify trend direction and use the outer lines to anticipate support and resistance levels for entries and exits.
Guide to Trade with the Standard Deviation Channel Indicator
Buy Rules
- Confirm the channel is sloping upward, indicating a bullish trend.
- Enter a buy trade near the lower support line of the channel.
- Ensure momentum is holding in the upward direction.
- Avoid buying if price is near the upper resistance line without a pullback.
Sell Rules
- Confirm the channel is sloping downward, indicating a bearish trend.
- Enter a sell trade near the upper resistance line of the channel.
- Ensure downward momentum continues before entry.
- Avoid selling near the lower support line unless price shows reversal signs.
Stop Loss
- Place stops just outside the channel lines opposite to your entry.
- For buys, below the lower deviation line; for sells, above the upper deviation line.
Take Profit
- Close buy trades near the upper resistance line; close sell trades near the lower support line.
- Alternatively, trail stops along the channel slope to capture extended trends.
Standard Deviation Channel and Best Forex Scalping Strategy MT4
This MT4 scalping strategy combines the Standard Deviation Channel MT4 Forex Indicator with the Best Forex Scalping Indicator MT4 to create a clear and structured approach for short term trading.
The Standard Deviation Channel Indicator helps traders identify trend direction and volatility by plotting dynamic upper and lower channel lines around price.
The Best Forex Scalping Indicator provides clear blue and red arrow signals directly on the chart.
This strategy is suitable for scalpers and intraday traders who prefer fast decisions and defined risk.
Recommended timeframes are M1, M5, and M15. It works well on major currency pairs such as EURUSD, GBPUSD, and AUDUSD during London and New York sessions.
Buy Entry Rules
- Price is trading above the middle line of the Standard Deviation Channel.
- The Standard Deviation Channel is upsloping, confirming a bullish market structure.
- Price pulls back toward the middle or lower channel without breaking below it.
- A blue arrow appears from the Best Forex Scalping Indicator MT4.
- Enter a buy trade at the close of the candle with the blue arrow.
- Stop loss is placed a few pips below the lower channel line.
- Take profit is set at the upper channel line or a fixed 5 to 25 pips depending on the timeframe.
Sell Entry Rules
- Price is trading below the middle line of the Standard Deviation Channel.
- The Standard Deviation Channel is downsloping, confirming a bearish market structure.
- Price retraces toward the middle or upper channel without breaking above it.
- A red arrow appears from the Best Forex Scalping Indicator MT4.
- Enter a sell trade at the close of the candle with the red arrow.
- Stop loss is placed a few pips above the upper channel line.
- Take profit is set at the lower channel line or a fixed 5 to 25 pips depending on the timeframe.
Advantages
- Clear trend identification using the Standard Deviation Channel.
- Precise entry timing with visual arrow signals.
- Works well on low timeframes for fast trades.
- Defined stop loss and take profit levels reduce emotional trading.
Drawbacks
- Requires discipline to follow stop loss rules.
- Scalping demands focus and fast execution.
Case Study 1
On EURUSD M5 during the London session, price stayed above the middle line of the Standard Deviation Channel, which was clearly sloping upward.
A short pullback brought the price close to the lower channel.
Shortly after, a blue arrow appeared from the Best Forex Scalping Indicator MT4.
A buy trade was opened and price quickly moved toward the upper channel, reaching a 15 pip profit before slowing down.
Case Study 2
On GBPUSD M1 during the New York session, price remained below the middle channel with a strong downward slope.
After a brief retracement toward the upper channel, a red arrow was printed on the chart.
A sell trade was taken and price dropped sharply within minutes, hitting a 12 pip take profit near the lower channel boundary.
Strategy Tips
- A blue arrow is a buy signal and should only be traded in bullish channel conditions.
- A red arrow is a sell signal and should only be traded in bearish channel conditions.
- Avoid trading when the channel is flat as market direction is unclear.
- Use fixed risk per trade to maintain consistent performance.
Download Now
Download the “StandardDeviationChannel.mq4” MT4 indicator
FAQ
Can the channel slope indicate trend strength?
Yes. Steeper slopes typically indicate stronger trends, while flatter slopes suggest weaker or sideways movement.
Can trades be taken against the channel slope?
It is possible but risky. Trading against the slope is counter-trend and should only be done with additional confirmation.
Summary
The Standard Deviation Channel Indicator provides a clear framework for trend-following and support/resistance trading.
By observing the channel slope and price interaction with the outer lines, traders can plan entries and exits aligned with the overall trend.
It is a versatile tool for intraday, swing, and trend-based strategies, offering visual guidance for identifying high-probability trading zones.


