
About the Stochastic Dashboard Indicator
The Stochastic Dashboard Indicator is a multi-timeframe trend analysis tool developed for MetaTrader 4 traders who rely on momentum-based confirmation.
Instead of switching between multiple charts, this indicator displays stochastic trend signals for several timeframes in one compact dashboard.
This saves time and helps traders maintain a consistent market view.
The dashboard tracks stochastic behavior across M1, M5, M15, M30, H1, and H4 charts.
Each timeframe is represented by arrows that indicate bullish or bearish momentum.
When all stochastic components move in the same direction, the indicator highlights strong trend alignment.
Buy and sell decisions are simplified through color agreement.
Green arrows across all stochastic readings signal bullish conditions, while red arrows signal bearish pressure.
When arrow colors are mixed, the indicator suggests standing aside.
This makes the Stochastic Dashboard especially useful for traders who want confirmation before entering trend-based trades.
Free Download
Download the “DK Stochastic Indicator.mq4” MT4 indicator
Key Features
- Multi-timeframe stochastic overview in one dashboard.
- Displays buy and sell arrows for six different timeframes.
- Requires full stochastic agreement for valid signals.
- Green arrows confirm bullish momentum.
- Red arrows confirm bearish momentum.
- Helps avoid trades during mixed or uncertain conditions.
Indicator Chart
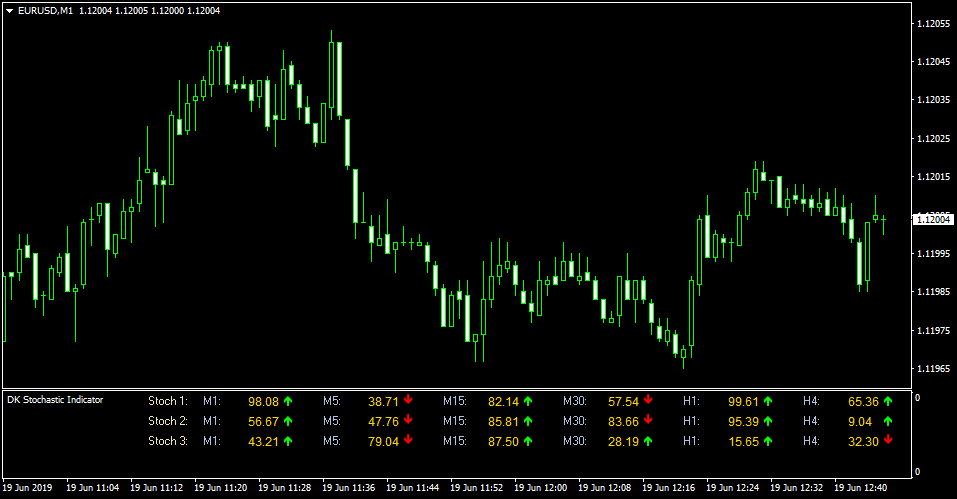
The Stochastic Dashboard Indicator chart presents a clean table showing arrow signals for each selected timeframe.
When all arrows turn green, bullish momentum is aligned across stochastic readings.
When all arrows turn red, bearish momentum dominates.
Guide to Trade with Stochastic Dashboard
Buy Rules
- Wait until all stochastic arrows across the dashboard turn green.
- Confirm that higher timeframes such as H1 or H4 are also bullish.
- Avoid buying if price is near major resistance levels.
- Enter a buy trade on the active chart after confirmation.
Sell Rules
- Wait until all stochastic arrows across the dashboard turn red.
- Confirm bearish momentum on higher timeframes.
- Avoid selling into strong support zones.
- Enter a sell trade on the active chart after confirmation.
Stop Loss
- Place the stop loss beyond the nearest higher timeframe support or resistance level.
- Set the stop loss using the high or low of the candle that confirmed full arrow alignment.
- Use a volatility-based stop derived from the recent average candle size.
- Exit the trade early if stochastic arrows lose full agreement across timeframes.
Take Profit
- Target the next visible support or resistance level.
- Use a fixed pip profit target of your preference.
- Exit the trade if stochastic arrows lose alignment.
Stochastic Dashboard and Zero Lag Moving Average MT4 Forex Strategy
This trading approach combines the multi-timeframe signals of the Stochastic Dashboard MT4 Indicator with the trend confirmation of the Zero Lag Moving Average MT4 Indicator.
It is designed for traders who want clear and consistent trend signals without relying on subjective chart reading.
The Stochastic Dashboard presents buy and sell conditions in the form of green or red arrows for M1, M5, M15, M30, H1, and H4.
A buy trend appears when Stoch 1, Stoch 2, and Stoch 3 all turn green at the same time.
A sell trend appears when all arrows turn red.
This alignment removes noise and keeps the trader focused on strong directional moments.
The Zero Lag Moving Average acts as a fast trend filter because it responds more quickly than a standard MA.
When the candle closes above it, the market has upward momentum. When it closes below it, the trend is downward.
Combining both tools results in a strategy that identifies precise entries with strong trend confirmation.
This method works well on M5, M15, and M30, but it can also be used on H1 for more stable swings.
Buy Entry Rules
- All Stochastic Dashboard arrows (Stoch 1, Stoch 2, Stoch 3) display green.
- The price closes above the Zero Lag Moving Average.
- Wait for the next candle to break the high of the signal candle.
- Place stop loss 15 to 25 pips below the Zero Lag Moving Average or below the recent swing low.
- Take profit at a fixed 2 to 1 reward ratio or at the next major resistance level.
Sell Entry Rules
- All Stochastic Dashboard arrows turn red.
- The price closes below the Zero Lag Moving Average.
- Wait for the next candle to break the low of the signal candle.
- Place stop loss 15 to 25 pips above the Zero Lag Moving Average or above the recent swing high.
- Take profit at a fixed 2 to 1 reward ratio or near the next support zone.
Advantages
- Multi-timeframe confirmation avoids weak trades.
- Zero Lag Moving Average gives early trend recognition.
- Clear rules make the method suitable for beginners.
- Works across multiple currency pairs.
- Can be used for both intraday and swing trades.
Drawbacks
- Strong news volatility may invalidate signals.
- Fast markets can cause the Zero Lag MA to produce whipsaws.
- Traders must wait for alignment, which reduces trade frequency.
- Best performance occurs in trending markets, not in narrow ranges.
Case Study 1
On EURUSD M15, the Stochastic Dashboard turned fully green across M1, M5, and M15.
Price had already crossed above the Zero Lag Moving Average and pulled back lightly before pushing upward again.
A buy position was opened when the next candle broke the previous high.
The stop was set 20 pips below the MA.
Momentum carried the pair upward for most of the session, and the plan closed at a 2:1 reward, finishing with a gain of about 48 pips.
Case Study 2
On GBPJPY M30, all Stochastic arrows turned red at the same moment that the price rejected the Zero Lag MA from below.
The next candle broke the signal candle low and triggered a sell entry.
The stop loss was placed 30 pips above the MA.
The pair moved strongly downward during the London session and reached the take profit target with roughly 95 pips profit.
Strategy Tips
- Avoid taking trades within the first minutes of major news releases.
- Always wait for full arrow alignment on the dashboard before acting.
- Use higher timeframes like H1 to confirm the overall trend direction.
- Pairs with consistent volatility, such as EURUSD, GBPJPY, and XAUUSD, work well.
- Keep risk per trade low to maintain account stability across many trades.
Download Now
Download the “DK Stochastic Indicator.mq4” Metatrader 4 indicator
FAQ
Why is full arrow agreement required for signals?
The indicator focuses on momentum alignment across multiple stochastic readings.
Full agreement helps filter weaker signals and improves trade reliability.
Mixed arrows often indicate consolidation or transition phases.
Can the indicator be customized?
Yes, the input values can be adjusted to change stochastic sensitivity.
This allows traders to adapt the dashboard to different pairs or trading styles.
Is the Stochastic Dashboard suitable for scalping?
It can be used for scalping when combined with M1 and M5 signals.
However, confirmation from higher timeframes is recommended to avoid false entries.
Summary
The Stochastic Dashboard Indicator provides a practical way to monitor stochastic trends across multiple timeframes from a single view.
Its arrow-based system simplifies momentum analysis and helps traders avoid low-quality setups.
By requiring full stochastic alignment, the indicator encourages disciplined trading and patience.


