
About the Stochastic Oscillator Indicator
The Stochastic Oscillator Indicator for MT4 is one of the most widely used tools in forex trading, helping traders identify overbought and oversold conditions in trending markets.
The indicator fluctuates between 0 and 100, where readings near 0 signal oversold conditions and readings near 100 indicate overbought levels.
These extremes help traders anticipate potential reversals or pullbacks.
Its effectiveness increases when combined with a trend-following tool, such as moving averages, Bollinger Bands, or ADMI. Following the trend while trading Stochastic signals helps filter out counter-trend entries and increases trade reliability.
The indicator is versatile and works for scalpers, day traders, swing traders, and even position traders looking for trend-aligned entries.
Free Download
Download the “Stochastic.mq4” MT4 indicator
Key Features
- The oscillator ranges from 0 to 100 to indicate overbought and oversold conditions.
- Generates simple buy and sell signals based on level crossovers.
- Ideal for trend-following setups when combined with other indicators.
- Helps traders identify short-term reversals and pullbacks.
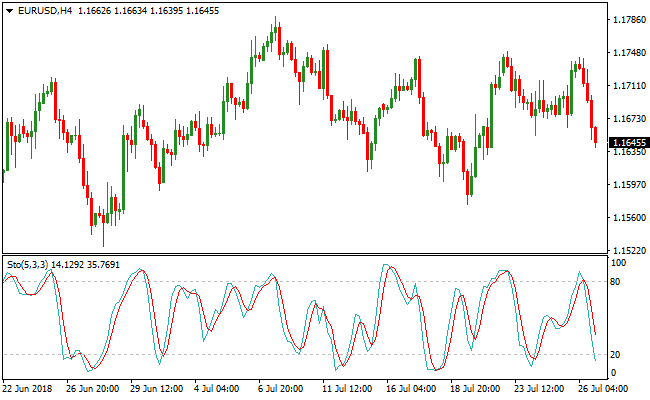
Indicator Chart
The Stochastic Oscillator Indicator is displayed beneath the main price area with a line graph that oscillates between 0 and 100.
Traders watch for readings near the 20 level for potential bullish signals and readings near the 80 level for bearish signals, allowing quick identification of market extremes in trending conditions.
Guide to Trade with the Stochastic Oscillator Indicator
Buy Rules
- Confirm the overall trend is bullish using a trend-following indicator.
- Wait for the Stochastic line to cross back above 20 from below.
- Enter a buy trade after the crossover occurs.
- Avoid signals during sideways or choppy market conditions.
Sell Rules
- Confirm the overall trend is bearish using a trend-following indicator.
- Wait for the Stochastic line to cross back below 80 from above.
- Enter a sell trade after the crossover occurs.
- Skip trades during low-momentum or ranging markets.
Stop Loss
- Place the stop below the recent swing low for buys or above the swing high for sells.
- Consider using ATR-based stops for dynamic positioning.
Take Profit
- Close buy trades near the 80 overbought level and sell trades near the 20 oversold level.
- Alternatively, trail stops as the Stochastic line moves favorably.
- Optionally target nearby support/resistance for extended moves.
Stochastic Oscillator & LRMA Bollinger Bands Indicator Low Risk Forex Strategy for MT4
This MT4 low-risk strategy combines momentum signals from the Stochastic Oscillator Indicator with trend direction from the LRMA Bollinger Bands Indicator.
The Stochastic Oscillator generates entry signals when momentum changes: buy trades are triggered when the Stochastic crosses back above 20 from below, and sell trades are triggered when it crosses below 80 from above.
The LRMA Bollinger Bands provide trend confirmation, where rising bands indicate bullish conditions and falling bands indicate bearish conditions.
Using these indicators together helps traders take trades in the direction of the trend while reducing risk by entering near oversold or overbought conditions.
Buy Entry Rules
- Confirm the trend is bullish by ensuring the LRMA Bollinger Bands are rising.
- Wait for the Stochastic Oscillator to cross back above 20 from below.
- Enter a buy trade immediately when the Stochastic crosses 20 in alignment with the bullish trend.
- Place the stop loss below the most recent swing low or lower Bollinger Band.
- Close the trade when the Stochastic crosses back below 80 or the Bollinger Bands begin to fall.
Sell Entry Rules
- Confirm the trend is bearish by ensuring the LRMA Bollinger Bands are falling.
- Wait for the Stochastic Oscillator to cross back below 80 from above.
- Enter a sell trade immediately when the Stochastic crosses 80 in alignment with the bearish trend.
- Place the stop loss above the most recent swing high or upper Bollinger Band.
- Close the trade when the Stochastic crosses back above 20 or the Bollinger Bands start rising.
Advantages
- Combines trend and momentum for low-risk, high-probability entries.
- Clear Stochastic signals make entry timing straightforward.
- LRMA Bollinger Bands filter trades in the direction of the trend.
- Works on multiple timeframes: M15, M30, and H1.
- Reduces exposure to countertrend trades and sudden volatility spikes.
Drawbacks
- Pullbacks can cause temporary false signals, requiring patience and discipline.
- Requires active monitoring to avoid missing Stochastic crossovers.
Case Study 1
On EURCHF M15 during the London session, the LRMA Bollinger Bands were rising, confirming a bullish trend.
The Stochastic crossed back above 20, signaling a buy.
A trade was entered with a stop loss below the recent swing low.
Price moved upward steadily, and the trade was closed when the Stochastic crossed back below 80, netting 26 pips.
Case Study 2
On GBPAUD M30 during the New York session, the LRMA Bollinger Bands were falling, indicating a bearish trend.
The Stochastic crossed below 80, signaling a sell.
A sell trade was entered with a stop loss above the recent swing high.
Price declined steadily, and the trade was closed when the Stochastic crossed above 20, capturing 49 pips.
Case Study 3
On AUDUSD H1 during the London session, the LRMA Bollinger Bands were rising.
The Stochastic crossed back above 20, generating a buy signal.
A trade was executed with a stop loss below the most recent swing low.
Price moved upward, and the trade was closed when the Stochastic crossed below 80, netting 51 pips.
Strategy Tips
- Focus on entering trades near the lower or upper edges of the Bollinger Bands to improve risk-reward on pullbacks.
- Wait for Stochastic crossovers to fully complete rather than entering prematurely to avoid false signals.
- Trade only the strongest trending pairs highlighted by the Symbol Movement or other volatility indicators for better consistency.
- Consider partial exits at key Fibonacci or pivot levels to lock in profits while leaving part of the position to run with the trend.
Download Now
Download the “Stochastic.mq4” MT4 indicator
FAQ
Which timeframe works best for the Stochastic Oscillator?
It works on all timeframes, but shorter timeframes produce more frequent signals for intraday trading, while longer timeframes give stronger trend alignment for swing trades.
Should I trade Stochastic signals against the trend?
No. Trading counter-trend signals increases risk. Aligning with a trend-following indicator improves reliability.
Can the Stochastic Oscillator be used alone?
It can provide signals independently, but combining it with trend indicators or support/resistance levels produces more accurate entries.
Summary
The Stochastic Oscillator Indicator helps traders identify overbought and oversold conditions within the context of the overall trend.
Its simple crossover signals make it easy to spot potential reversal points, while the combination of trend alignment and momentum analysis enhances trading decisions.
Versatile across all timeframes and trading styles, it is a valuable tool for scalpers, day traders, swing traders, and position traders alike.


