
About the Stop and Reverse Indicator
The Stop and Reverse (SAR) Forex Signal Indicator for MT4 is a powerful tool that helps traders identify potential trend reversals with clear buy and sell signals.
It’s based on a classic trend-following logic and works well in trending markets.
The indicator displays colored arrows on the chart, giving traders simple and actionable trade opportunities.
Key Benefits of the Indicator
- Prints clear buy and sell arrows directly on the chart
- Detects potential reversal points in both up and down trends
- Ideal for swing trading and intraday trading setups
- Easy-to-understand visual signals for fast trade decisions
- Works across all MT4 timeframes and currency pairs
Free Download
Download the “auto-stop-revers-indicator.mq4” indicator for MT4
Advantages of Using This Indicator
- Pinpoints early entries in new trends
- Helps reduce emotional decision-making
- Remains stable (non-repainting) after candle close
- Great for combining with other tools like Moving Averages, MACD, or Bollinger Bands
Indicator Example Chart (EUR/USD M15)
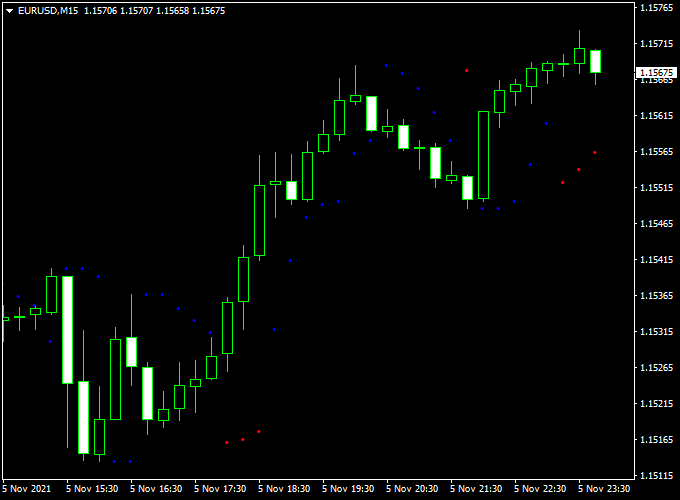
How To Trade Using This Indicator
- Open a buy trade as soon as the first blue or red dot appears below the candlestick.
- Open a sell trade as soon as the first blue or red dot appears above the candlestick.
- Exit the open trade whenever the opposite trading signal appears on the chart.
Download Now
Download the “auto-stop-revers-indicator.mq4” indicator for Metatrader 4
Stop and Reverse + Buyers vs Sellers Dashboard Strategy for MT4
This strategy combines the precise trend reversal detection of the Stop and Reverse Forex Signal Indicator with the market strength visualization of the Buyers vs Sellers Dashboard Indicator.
Together, these indicators allow traders to identify early trend reversals and validate them with real-time buyer/seller pressure analysis on the MetaTrader 4 platform.
What Is This Strategy About?
The Stop and Reverse Indicator (SAR) gives visual trend reversal signals directly on the chart, helping traders spot turning points in the market.
The Buyers vs Sellers Dashboard aggregates market sentiment across multiple timeframes, displaying whether bulls or bears are currently in control.
By combining these tools, traders can avoid false reversals and confirm their entries based on order flow strength.
Buy Rules
- Wait for a buy signal from the Stop and Reverse Indicator, typically a dot or arrow appearing below the price, signaling a trend reversal to the upside.
- Confirm that the Buyers vs Sellers Dashboard is showing buyer dominance (majority of timeframes showing buyers in control).
- Enter a buy trade at the open of the next candle after confirmation.
- Place a stop loss just below the recent swing low or below the SAR reversal dot.
- Set the take profit at the next resistance level or use a trailing stop as indicated by SAR dots.
Sell Rules
- Wait for a sell signal from the Stop and Reverse Indicator, shown by a reversal dot or arrow above the price.
- Ensure the Buyers vs Sellers Dashboard displays seller dominance (majority of timeframes favoring sellers).
- Open a sell position at the next candle open after both conditions are met.
- Place a stop loss just above the recent swing high or SAR dot.
- Target the next support level or trail the stop based on ongoing SAR signals.
Advantages
- Early reversal detection: SAR provides fast visual clues when trends shift direction.
- Sentiment confirmation: The Buyers vs Sellers Dashboard avoids counter-trend trades by confirming market pressure.
- Simple and visual: Easy-to-read signals with minimal chart clutter.
- Useful on any timeframe: Works well for intraday and swing trading (M15, H1, H4).
Drawbacks
- False signals in consolidation: SAR may give premature signals during sideways movement.
- Lagging sentiment shifts: Dashboard can sometimes reflect pressure too late after a move begins.
- Requires both signals: Success depends on waiting for alignment between the two tools, which may reduce trade frequency.
Final Strategy Thoughts
Combining the Stop and Reverse Forex Signal Indicator with the Buyers vs Sellers Dashboard Indicator creates a disciplined strategy for catching early trend reversals backed by real-time sentiment.
It’s especially effective for traders who value precision and confirmation before entering the market.
Always practice proper risk management and avoid trading during low-volume or choppy sessions.
Case Study Example
USD/CHF H1 Chart Analysis (Sample Period: 2 Months)
- Total Signals: 42 trades
- Winning Trades: 28 (66.7%)
- Average Win: +32 pips
- Average Loss: -16 pips
- Net Result: +672 pips over the testing period
Indicator Specifications
| Indicator Name | Stop and Reverse Forex Signal |
|---|---|
| Platform | MetaTrader 4 (MT4) |
| Timeframes | All timeframes |
| Currency Pairs | All major and minor pairs |
| Signal Colors | Aqua (Buy), Magenta (Sell) |
| Repaint | No |
| Inputs |
|
Final Words
The Stop and Reverse Forex Signal Indicator for MT4 is ideal for traders looking to catch early trend reversals with minimal noise.
Its clear visual cues make it a great companion for manual trading strategies.
Download it now and experience how simple yet powerful this tool can be.


