
The Super Smoother Forex Winner indicator for Metatrader 5 follows the best trend and forecasts price movements for any currency pair.
The indicator is displayed in the price chart as an alternating colored signal line.
How to trade FX with the Super Smoother indicator?
- The green colored Super Smoother signal line represents a bullish trend.
- The brown colored Super Smoother signal line represents a bearish trend.
The following indicator inputs and parameters can be modified: period, median price, colors, and style.
Tip: The London and New York trading sessions will deliver the best trading results for scalpers and day traders.
It works for Forex, Stocks, Indices, Gold, Bitcoin, etc.
Please make yourself familiar with this technical indicator and test it first on a demo account for an extended period.
Download Indicator 🆓
Super smoother.mq5 Indicator (MT5)
Chart Example
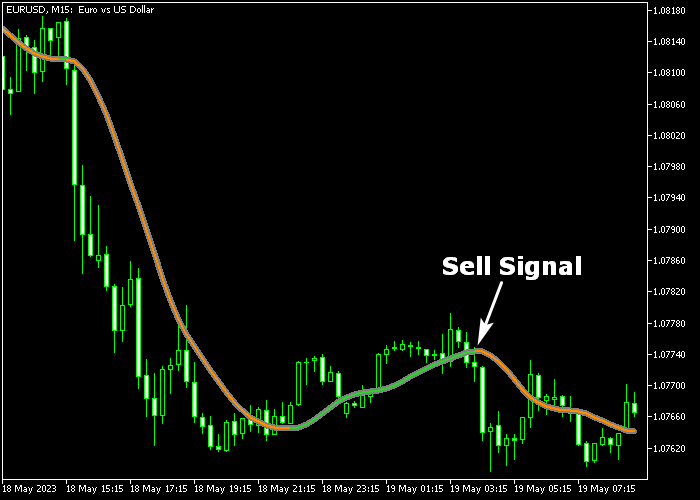
The following chart shows what the Super Smoother Forex Winner indicator looks like when applied to the MT5 chart.
How To Buy And Sell Currency Pairs With The Super Smoother Forex Winner Indicator?
Find a simple trading example below:
Buy Signal
- The appearance of the green colored super smoother line is a buy entry.
- Initiate a long trade and set a protective stop loss below medium-term support.
- Exit the buy trade for a risk/reward ratio of at least 1 or better.
Sell Signal
- The appearance of the brown colored super smoother line is a sell entry.
- Initiate a short trade and set a protective stop loss above medium-term resistance.
- Exit the sell trade for a risk/reward ratio of at least 1 or better.
Download Now 🆓
Super smoother.mq5 Indicator (MT5)
Frequently Asked Questions
How Do I Install This Custom Indicator On Metatrader 5?
- Open the MT5 trading platform
- Click on the File menu button located at the top left part of the platform
- Click on Open Data Folder > MQL5 folder > Indicators
- Copy the Super smoother.mq5 indicator file in the Indicators folder
- Close and restart the trading platform
- You will find the indicator here (Navigator window > Indicators)
- Drag the indicator to the chart to get started with it!
How Do I Edit This Indicator?
- Click in the open chart with your right mouse button
- In the dropdown menu, click on Indicator List
- Select the indicator and click on properties
- Now you can edit the inputs, colors, levels, scale and visualization
- Finally click the OK button to save the new configuration