
About the Supply & Demand Zones Indicator
The Supply & Demand Zones Indicator for MT4 identifies the most important areas of support and resistance on your chart.
It automatically draws blue and red zones, helping traders pinpoint where price is likely to reverse or continue.
This allows for smarter trade entries and exits without manually analyzing past price movements.
Beginner-friendly and easy to use, the indicator works on all currency pairs and timeframes.
It’s ideal for spotting high-probability trade setups and aligning trades with market momentum.
Visually highlighting supply and demand zones helps traders focus on the most significant levels, making decision-making faster and more effective.
Free Download
Download the “i-supply-demand-zones.mq4” indicator for MT4
Key Features
- Automatically identifies key supply (red) and demand (blue) zones
- Displays zones directly on the main MT4 chart window
- Helps traders identify potential reversal and breakout points
- Beginner-friendly, works out of the box
- Can be combined with trend or candlestick indicators
Indicator Chart
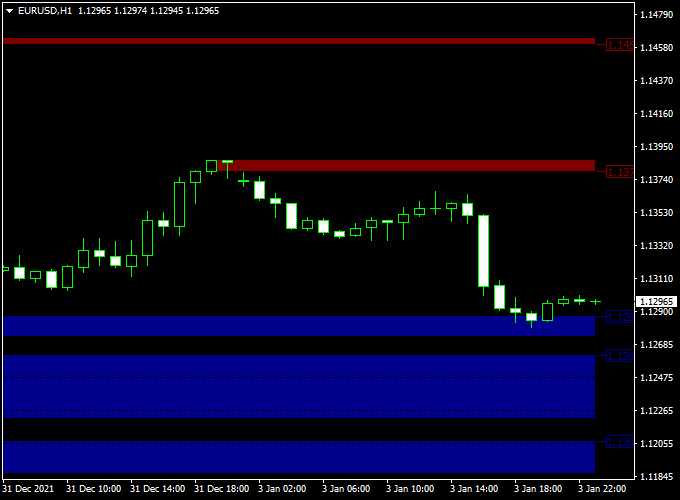
The chart below shows the Supply & Demand Zones Indicator in action.
Blue zones highlight demand areas for potential buy entries, and red zones highlight supply areas for potential sell entries.
Traders can use these zones to enter trades aligned with the trend.
Guide to Trade with Supply & Demand Zones Indicator
Buy Rules
- Enter a buy trade when price touches a blue demand zone in an uptrend
- Confirm with trend direction or candlestick signals
- Reverse position if price enters a red supply zone and signals a downtrend
Sell Rules
- Enter a sell trade when price touches a red supply zone in a downtrend
- Confirm with trend direction or candlestick signals
- Reverse position if price enters a blue demand zone and signals an uptrend
Stop Loss
- Place a few pips below the demand zone for buys
- Place a few pips above the supply zone for sells
Take Profit
- Set at the next supply/demand zone
- Or exit when the trend shows signs of reversal
Practical Tips
- Focus on the largest, most significant zones for higher probability trades
- Use higher timeframe confirmation to filter minor zones
- Combine with candlestick patterns or trend indicators for more reliable entries
- Wait for the price to reach zones before entering trades to avoid premature entries
- Test setups on a demo account to get familiar with zone behavior
Supply Demand Zones + Zero Lag MACD Intraday Strategy for MT4
This intraday trading strategy combines the Supply Demand Zones Indicator with the Zero Lag MACD Indicator for MT4.
It focuses on trading high-probability reversals or continuations from key support and resistance areas, while using MACD momentum to confirm direction.
The setup is simple to follow and offers reliable entries during active market hours.
The Supply Demand Zones Indicator automatically highlights important price areas where institutional buyers or sellers are likely to react.
The Zero Lag MACD Indicator then helps confirm momentum by showing a histogram above or below the zero line.
When both tools agree, the chance of catching a strong intraday move increases significantly.
This strategy works best on the M15 or M30 timeframes and suits traders who prefer clear structure and confirmation before entering the market.
It performs well on major pairs like EURUSD, GBPUSD, and gold, especially during the London and New York sessions.
Buy Entry Rules
- Wait for price to reach or bounce from a demand zone displayed by the Supply Demand Zones Indicator.
- Confirm that the Zero Lag MACD histogram is above the zero line, showing bullish momentum.
- Enter a buy trade at the open of the next candle after confirmation.
- Place the stop loss below the most recent demand zone or 10–15 pips below the entry.
- Set take profit near the next supply zone or at a 1.5 to 2 times risk-to-reward level.
- Optional: move stop loss to breakeven after gaining 15 pips in profit.
Sell Entry Rules
- Wait for price to reach or reject from a supply zone displayed by the Supply Demand Zones Indicator.
- Confirm that the Zero Lag MACD histogram is below the zero line, showing bearish momentum.
- Enter a sell trade at the open of the next candle after confirmation.
- Place the stop loss above the recent supply zone or 10–15 pips above the entry.
- Set take profit near the next demand zone or at a 1.5 to 2 times risk-to-reward level.
- Optional: secure partial profits when the trade reaches halfway to the target.
Advantages
- Combines price action zones with momentum confirmation for higher accuracy.
- Prevents premature entries by waiting for MACD agreement.
- Adaptable to different forex pairs and timeframes.
- Works best during trending intraday conditions with clear support and resistance zones.
- Helps visualize institutional order flow and reaction levels.
Drawbacks
- Less effective during flat or low-volume markets where zones overlap.
- Requires patience to wait for the right zone and MACD confirmation.
- False signals may occur if zones are weak or freshly formed.
- Best performance depends on proper zone sensitivity settings.
Example Case Study 1: EURUSD M15
During the London session, price touched a clearly defined demand zone at 1.0725.
The Zero Lag MACD histogram moved above zero on the next candle, confirming bullish momentum.
A buy trade was entered at 1.0730 with a stop loss at 1.0715.
The pair rallied toward the next supply zone at 1.0760, hitting take profit for a 30-pip gain within one hour.
Example Case Study 2: XAUUSD M30
In the early New York session, gold reached a strong supply zone near 2368.
The Zero Lag MACD histogram turned negative, showing bearish strength.
A sell was entered at 2365 with a stop loss at 2372 and a take profit at 2350.
The price dropped steadily, hitting the target for 15 pips profit per $1 move in gold within two hours.
Strategy Tips
- Trade only zones that are well-formed and recently respected by price.
- Wait for MACD confirmation before taking any position; this filters false breakouts.
- Focus on the first or second touch of a zone for stronger reactions.
- Avoid trading during major news events or low liquidity hours.
- Backtest the combination on multiple pairs to find optimal MACD parameters.
- Keep risk per trade small, ideally 1–2% of total account balance.
Download Now
Download the “i-supply-demand-zones.mq4” indicator for Metatrader 4
FAQ
How does the Supply & Demand Zones Indicator work?
It automatically plots blue and red zones to mark key support (demand) and resistance (supply) areas where price may reverse or continue.
Do I need other indicators to trade effectively?
While it works alone, combining with trend indicators or candlestick patterns improves trade timing and accuracy.
How do I adjust the zone settings?
Settings allow you to customize zone sensitivity and colors. Adjust based on trading style and preferred timeframe.
Summary
The Supply & Demand Zones Indicator is a powerful tool for spotting key levels of support and resistance on MT4 charts.
Blue and red zones help traders identify potential buy and sell areas aligned with market trends.
It is beginner-friendly, lightweight, and works on all currency pairs and timeframes.
Combining this indicator with trend analysis or candlestick patterns improves accuracy and helps traders make more confident decisions.
Using zone reversals and breakouts dynamically can lead to better trade entries and exits.
This indicator is a valuable addition to any trading strategy.


