About the Symbol Movement Indicator
The Symbol Movement Indicator for MT4 tracks daily price ranges for 28 major and minor currency pairs, including EUR/USD, GBP/USD, USD/JPY, USD/CAD, and NZD/USD.
It provides traders with an overview of high and low levels for each pair, along with real-time bullish and bearish candle data.
This makes it easier to assess market activity and potential breakout or pullback opportunities.
By offering a clear snapshot of multiple pairs in one view, traders can quickly compare volatility and momentum, identify the most active instruments, and plan trades accordingly.
The indicator is especially useful for day traders, scalpers, and anyone looking to focus on the strongest or most volatile currency pairs in a given session.
Free Download
Download the “Symbol Movement.mq4” MT4 indicator
Key Features
- Tracks daily high and low ranges for 28 currency pairs.
- Displays bullish and bearish candle activity based on real market data.
- Helps identify the most volatile and active instruments for the day.
- Works across multiple timeframes for day trading and intraday analysis.
- Provides a consolidated view of key market movements in one panel.
Indicator Chart
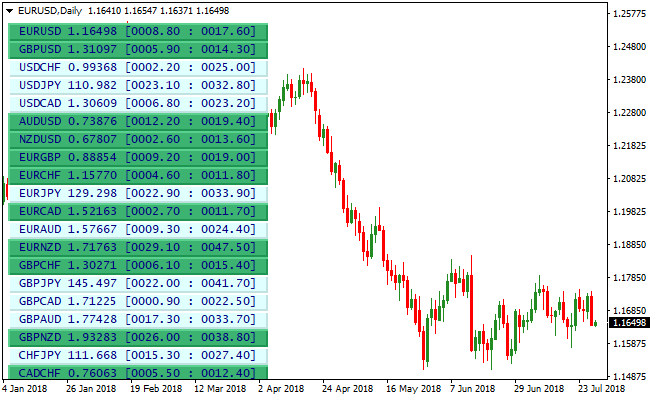
The Symbol Movement Indicator appears beneath the main price area in a dedicated panel for easy monitoring of multiple pairs.
It shows daily high and low levels along with bullish and bearish candle activity, allowing traders to quickly spot which currencies are trending, range-bound, or experiencing strong momentum.

Guide to Trade with Symbol Movement Indicator
Buy Rules
- Identify currency pairs with bullish candle activity above the daily range midpoint.
- Confirm momentum is continuing in the current session.
- Enter a buy trade when the pair shows consistent upward movement in real-time candles.
- Focus on the most active pairs for stronger follow-through.
Sell Rules
- Identify currency pairs with bearish candle activity below the daily range midpoint.
- Confirm momentum continues downward in the session.
- Enter a sell trade when real-time candles maintain bearish movement.
- Prioritize the pairs showing the largest daily range drops for stronger signals.
Stop Loss
- Place the stop just beyond the daily high for sell trades or daily low for buy trades.
- Use a buffer to avoid being stopped out by intraday spikes.
- Adjust based on the pair’s average daily range.
Take Profit
- Close trades when price approaches the opposite end of the daily range.
- Partial profit can be taken at mid-range levels for conservative exits.
- Alternatively, trail stops as price moves favorably within the daily range.
- Optionally target the next day’s opening price or key support/resistance for extended targets.
Symbol Movement & Trend Predictor Forex Pullback Strategy for MT4
This MT4 pullback strategy combines volatility insights from the Symbol Movement 28 Currency Pairs Indicator with precise entry signals from the Trend Predictor V1.0 Forex Indicator.
The Symbol Movement indicator displays the daily range, high and low prices, and bull/bear candles for 28 currency pairs, helping traders identify strong trending pairs and potential pullback levels.
The Trend Predictor provides buy and sell arrows, with blue arrows signaling bullish entries and red arrows signaling bearish entries.
This combination allows traders to enter trades during pullbacks in the direction of the prevailing trend.
This strategy works well on M15, M30, and H1 charts and is suitable for day traders looking for structured pullback opportunities.
By using volatility and trend confirmation together, traders can filter weak signals and increase the probability of capturing profitable retracements.
Buy Entry Rules
- Identify a strong bullish trend using the Symbol Movement indicator by noting consistent bull candles and a high daily range.
- Wait for a pullback in price, ideally approaching recent support or a minor retracement within the daily range.
- Confirm a buy signal when the Trend Predictor displays a blue arrow.
- Enter a buy trade immediately after the blue arrow appears in alignment with the bullish trend.
- Place the stop loss below the most recent swing low or minor support level.
- Close the trade when the Trend Predictor shows a red arrow indicating potential reversal.
Sell Entry Rules
- Identify a strong bearish trend using the Symbol Movement indicator by noting consistent bear candles and a significant daily range.
- Wait for a pullback in price, ideally approaching recent resistance or a minor retracement within the trend.
- Confirm a sell signal when the Trend Predictor displays a red arrow.
- Enter a sell trade immediately after the red arrow appears in alignment with the bearish trend.
- Place the stop loss above the most recent swing high or minor resistance level.
- Close the trade when the Trend Predictor shows a blue arrow indicating a potential reversal.
Advantages
- Combines trend strength and pullback timing for higher probability entries.
- Helps identify the most active currency pairs with strong daily movement.
- Works on multiple timeframes: M15, M30, and H1.
- Reduces risk of entering weak trends by using daily range and candle data for confirmation.
Drawbacks
- Requires patience to wait for pullbacks within a strong trend.
- Stop losses may be hit if pullbacks are deeper than anticipated.
Case Study 1
On EURUSD M15 during the London session, the Symbol Movement indicator showed strong bullish activity with multiple consecutive bull candles.
Price retraced slightly toward a support level, and the Trend Predictor displayed a blue arrow.
A buy trade was entered with a stop loss below the recent swing low.
Price rallied in line with the trend, and the trade was closed when a red arrow appeared, netting 24 pips.
Case Study 2
On GBPUSD M30 during the New York session, the Symbol Movement indicator confirmed a bearish trend with a wide daily range and strong bear candles.
Price pulled back toward a minor resistance, and a red Trend Predictor arrow appeared.
A sell trade was entered with a stop loss above the recent swing high.
Price declined as expected, and the trade was closed when a blue arrow appeared, capturing 47 pips.
Strategy Tips
- Focus on pairs with strong daily ranges on the Symbol Movement indicator for higher probability pullback trades.
- Only enter trades when the Trend Predictor arrow aligns with the overall trend to reduce false signals.
- Use appropriate stop losses based on recent swing highs and lows to protect against unexpected reversals.
- Track performance on different timeframes to identify which pairs and setups work best for your trading style.
- Close trades promptly when Trend Predictor arrows flip to lock in profits and reduce exposure.
Download Now
Download the “Symbol Movement.mq4” MT4 indicator
FAQ
Can I monitor all 28 currency pairs at the same time?
Yes. The indicator consolidates multiple pairs into one panel for quick analysis and comparison.
Does the indicator provide real-time updates?
Yes. Candle activity and daily range values update in real time based on market movement.
Which traders benefit most from this indicator?
Day traders and scalpers benefit the most, as it highlights active pairs and current volatility across multiple instruments.
Can the Symbol Movement Indicator predict breakouts?
It does not predict exact breakouts, but high daily range activity and consistent candle momentum help traders identify pairs likely to move further.
Summary
The Symbol Movement Indicator provides a clear, consolidated view of daily ranges and bullish/bearish activity for 28 currency pairs.
Traders can quickly spot active pairs, evaluate momentum, and plan trades based on current market dynamics.
Its real-time updates make it a useful tool for day trading and intraday analysis across multiple instruments simultaneously.


