
About the Timing Colored Signals indicator
The Timing Colored Signals indicator for MT4 is a straightforward oscillator that helps traders identify buy and sell opportunities.
It fluctuates between 0 and 100, signaling overbought and oversold conditions.
Values near 100 indicate the market is overbought, while values close to 0 indicate oversold levels.
The indicator draws a colored signal line to highlight market trends: green for bullish, orange for bearish, and yellow for flat or sideways conditions.
Traders can quickly see when to enter or exit trades by following the signal line.
This indicator works best when combined with a trend-following tool.
By taking trades in the direction of the prevailing trend, traders can filter out false signals and improve their success rate.
Timing Colored Signals is ideal for short-term swing trading, intraday setups, and confirming entry points on higher timeframes.
Free Download
Download the “timing-indicator.mq4” MT4 indicator
Key Features
- Colored signal line showing bullish, bearish, or flat trends.
- Oscillator ranges between 0 and 100 to indicate overbought and oversold levels.
- Simple buy and sell signal interpretation for faster decision-making.
- Compatible with other trend-following indicators for better trade accuracy.
- Works on multiple timeframes, from M1 to daily charts.
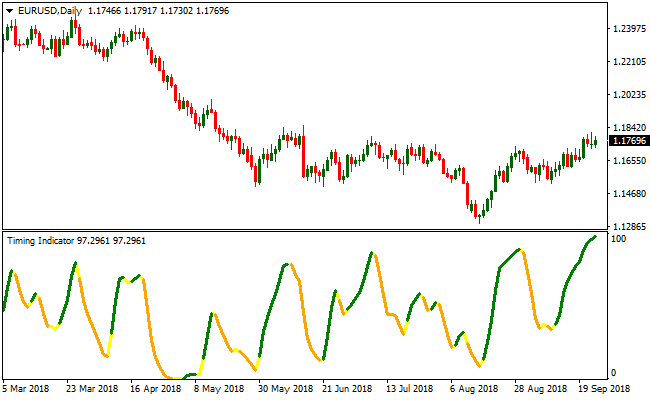
Indicator Chart
The chart below displays clear trend signals using green, orange, and yellow lines.
Green lines suggest bullish momentum, orange lines indicate bearish pressure, and yellow lines signal sideways markets.
Guide to Trade with Timing Colored Signals Indicator
Buy Rules
- Enter a long position when the signal line turns green.
- Confirm trend direction with a trend-following indicator.
- Avoid buying if the line is yellow or market is overbought above 80.
- Combine with support levels to increase probability of success.
Sell Rules
- Open a short position when the signal line turns orange.
- Verify downtrend with a trend-following tool.
- Do not sell if the line is yellow or market is oversold below 20.
- Consider resistance areas for better entry timing.
Stop Loss
- Place a stop loss a fixed number of pips below the entry for buys.
- Place a stop loss a fixed number of pips above the entry for sells.
- Adjust the stop based on the Average True Range (ATR) for market volatility.
- Move stop to break-even once the trade moves in your favor.
Take Profit
- Close long trades when the signal line changes from green to yellow or orange.
- Close short trades when the signal line changes from orange to yellow or green.
- Consider trailing profits along the trend to capture extended moves.
Timing Colored Signals + Zero Lag Moving Average MT4 Strategy
This MT4 strategy combines the fast signal behavior of the Timing Colored Signals indicator with the trend smoothing strength of the Zero Lag Moving Average indicator.
Both tools complement each other well. The oscillator provides early turning points while the moving average defines the dominant market direction.
This keeps the strategy simple and suitable for beginners and for traders who want a clean chart with clear trend confirmation.
The setup works best on M15, M30 and H1.
These time frames reduce chart noise, allowing the moving average to identify trends more reliably.
Short-term scalpers can still use it, but the examples below focus on intraday and swing movements for better consistency.
Buy Entry Rules
- The Timing Colored Signals oscillator must drop to the 0 level and then start drawing a green line.
- The Zero Lag Moving Average must be sloping upward and price must be above it.
- Enter the buy trade once the candle closes above the moving average in the direction of the new green signal.
- Stop loss is placed a few pips below the last swing low.
- Take profit when the Timing Colored Signals indicator changes color to orange.
Sell Entry Rules
- The Timing Colored Signals oscillator must reach the 100 level and then start drawing an orange line.
- The Zero Lag Moving Average must be sloping downward and price must be below it.
- Enter the sell trade once the candle closes below the moving average in the direction of the new orange signal.
- Stop loss is placed a few pips above the last swing high.
- Take profit when the Timing Colored Signals indicator changes color to green.
Advantages
- Combines early momentum signals with reliable trend direction.
- Works across many currency pairs and sessions.
- Can adapt to intraday and swing trading.
Drawbacks
- Signal delays can occur after sharp spikes in price.
- Requires discipline to avoid trading against the moving average.
Case Study 1
On EURUSD M30 during the London session, the oscillator touched the 0 level after a short pullback and then turned green.
At the same time, price remained above the Zero Lag Moving Average which was pointing upward.
The next candle closed above the moving average and confirmed trend continuation.
A buy trade was taken with a stop loss below the previous swing low.
Price moved steadily for the next hour and hit a 28 pip target.
The movement aligned perfectly with the early green signal and the trend direction of the moving average.
Case Study 2
On GBPUSD H1, the oscillator reached the 100 level after an extended push upward.
The Timing oscillator turned orange which hinted that bullish momentum was weakening.
Price also closed below the Zero Lag Moving Average which had already begun to turn downward.
A sell trade was taken with a stop loss above the recent spike high.
The market dropped through the next support zone and produced a clean 42 pip profit.
The combination of the orange reversal signal and the downward moving average provided strong alignment.
Strategy Tips
- Buy setups are stronger when the oscillator reaches the 0 level, turns green and price stays above the Zero Lag Moving Average.
- Sell setups work best when the oscillator reaches the 100 level, turns orange and price trades below the Zero Lag Moving Average.
- Avoid trading when the moving average is flat because the market is usually ranging.
- Do not hold a trade once the Timing indicator changes color against your position because momentum is shifting.
- Use MACD as an extra filter. Above zero supports buy trades. Below zero supports sell trades.
- Always check for upcoming news releases to avoid sudden spikes that can disrupt clean trend setups.
Download Now
Download the “timing-indicator.mq4” Metatrader 4 indicator
FAQ
What do the different colors mean?
Green indicates bullish momentum, orange shows bearish momentum, and yellow signals a flat or neutral market condition.
How should I adjust it for volatile markets?
Use wider stop losses and consider combining it with a volatility filter to avoid false signals during high market swings.
Summary
The Timing Colored Signals indicator provides fast, easy-to-read buy and sell signals for forex traders.
Its color-coded line simplifies market interpretation and helps traders enter positions with confidence.
When used with a trend-following tool, it increases the probability of profitable trades.
Regular users may improve performance by combining it with support and resistance analysis or other confirming indicators.


