About the Tipu CCI Indicator
The Tipu CCI Indicator for MT4 uses the Commodity Channel Index to generate short-term trading signals within the context of the overall trend.
The indicator plots a histogram beneath the main price area, with blue bars indicating bullish pressure and red bars showing bearish momentum.
Traders can also enable arrows on the main price area for easy signal identification.
The system works by highlighting zero-line crossovers.
A crossover above zero signals short-term bullish momentum, while a crossover below zero signals short-term bearish momentum.
Combining Tipu CCI with a trend-following tool like a moving average or Bollinger Bands improves accuracy.
This indicator is suitable for intraday traders and swing traders looking to enter in line with the main trend and capture short-term moves efficiently.
Free Download
Download the “Tipu CCI.mq4” MT4 indicator
Key Features
- CCI-based histogram showing short-term momentum.
- Optional buy and sell arrows displayed directly on the main price area.
- Blue bars and arrows indicate bullish conditions; red bars and arrows indicate bearish conditions.
- Works best when aligned with trend-following indicators.
Indicator Chart
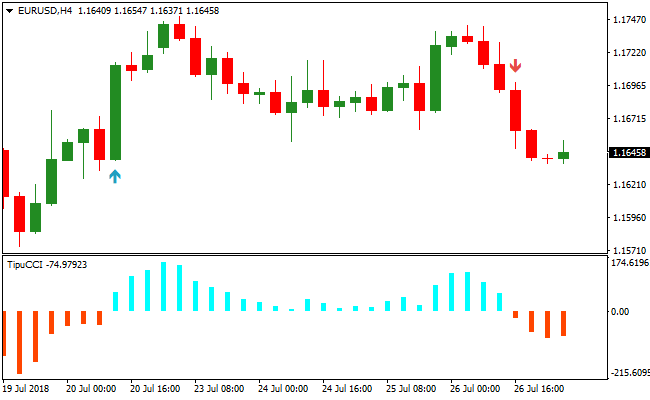
The Tipu CCI Indicator is displayed beneath the main price area with a colored histogram and optional arrows.
Blue bars show short-term bullish momentum, and red bars indicate short-term bearish pressure.
Traders watch zero-line crossovers to identify entry opportunities in the direction of the prevailing trend.

Guide to Trade with Tipu CCI Indicator
Buy Rules
- Confirm the overall trend is bullish using a trend-following indicator.
- Wait for the CCI histogram to cross above zero from below.
- Enter a buy trade on the first blue bar or arrow after the crossover.
- Avoid trades during sideways or low-volatility market conditions.
Sell Rules
- Confirm the overall trend is bearish using a trend-following indicator.
- Wait for the CCI histogram to cross below zero from above.
- Enter a sell trade on the first red bar or arrow after the crossover.
- Skip trades during choppy or ranging markets.
Stop Loss
- Place the stop just beyond the last minor swing low for buys or swing high for sells.
- Use a small buffer above/below the entry to prevent premature stop-outs.
- Alternatively, use ATR (Average True Range) multiplied by 1–1.5 to define a dynamic stop.
Take Profit
- Close trades when the CCI histogram reverses and crosses back through zero.
- Partial exit can be taken at the next minor swing high (for buys) or swing low (for sells).
- Optionally target a multiple of the stop distance for fixed risk/reward exits.
- Trail the trade using the last extreme bar in the histogram as a reference to capture extended moves.
Tipu CCI & SuperTrend MTF Indicator Forex Day Trading Strategy MT4
This MT4 day trading strategy combines momentum confirmation from the Tipu CCI Commodity Channel Index Indicator with trend direction from the SuperTrend MTF Forex Signal Indicator.
The Tipu CCI generates clear signals: a buy trade occurs when the CCI crosses back above 0.00 from below (first blue bar), and a sell trade occurs when it crosses below 0.00 from above (first red bar).
The SuperTrend MTF line confirms the prevailing trend, with green indicating bullish momentum and red indicating bearish momentum.
Combining these two indicators helps traders identify high-probability day trading setups on multiple timeframes.
This strategy works well on M5, M15, and H1 charts, making it flexible for scalping or slightly longer intraday trades.
Buy Entry Rules
- Confirm the trend with the SuperTrend MTF indicator: the line must be green, indicating a bullish trend.
- Wait for the Tipu CCI histogram to cross back above 0.00 from below.
- Enter a buy trade immediately when the first blue bar appears while the SuperTrend is green.
- Place the stop loss below the most recent swing low or minor support level.
- Close the trade when the SuperTrend line turns red or the Tipu CCI crosses below 0.00.
Sell Entry Rules
- Confirm the trend with the SuperTrend MTF indicator: the line must be red, indicating a bearish trend.
- Wait for the Tipu CCI histogram to cross back below 0.00 from above.
- Enter a sell trade immediately when the first red bar appears while the SuperTrend is red.
- Place the stop loss above the most recent swing high or minor resistance level.
- Close the trade when the SuperTrend line turns green or the Tipu CCI crosses above 0.00.
Advantages
- Combines trend and momentum for high-probability day trading setups.
- Clear entry & exit signals reduce hesitation and improve trade timing.
- Flexible across multiple timeframes: M5, M15, and H1.
- Helps avoid countertrend trades by confirming trend direction.
- Works well on multiple currency pairs, providing consistent intraday opportunities.
Drawbacks
- Small stop losses are sensitive to short-term volatility.
- False CCI crossings can occur during choppy or sideways markets.
- Trend reversals can lead to early exits if relying only on the SuperTrend color change.
- Performance can be reduced during low liquidity or outside major trading sessions.
Case Study 1
On EURUSD M5 during the London session, the SuperTrend MTF line was green, confirming a bullish trend.
The Tipu CCI crossed back above 0.00, generating a buy signal.
A buy trade was entered with a stop loss below the recent swing low.
Price moved upward steadily, and the trade was closed when the SuperTrend line turned red, netting 15 pips.
Case Study 2
On GBPJPY M15 during the New York session, the SuperTrend line was red, indicating bearish momentum.
The Tipu CCI crossed below 0.00, signaling a sell.
A sell trade was executed with a stop loss above the recent swing high.
Price declined steadily, and the trade was closed when the SuperTrend line turned green, capturing 42 pips.
Case Study 3
On AUDUSD H1 during the London session, the SuperTrend line was green, confirming a bullish trend.
The Tipu CCI crossed above 0.00, signaling a buy.
A trade was entered with a stop loss below the most recent swing low.
Price rallied steadily, and the trade was closed when the SuperTrend line turned red, netting 67 pips.
Strategy Tips
- Only take trades when the Tipu CCI signal aligns with the SuperTrend MTF trend to ensure higher probability setups.
- Use tight stop losses appropriate to the timeframe and volatility for effective risk management.
- Close trades promptly when either the Tipu CCI crosses the 0.00 line in the opposite direction or the SuperTrend changes color.
Download Now
Download the “Tipu CCI.mq4” MT4 indicator
FAQ
Should I use the histogram or the arrows for trading?
Both are useful. Histograms give continuous momentum insight, while arrows highlight the actual zero-line crossovers for easier entry timing.
Is Tipu CCI effective in trending or ranging markets?
It performs best when trades align with the main trend. During sideways markets, signals may be less reliable, so extra filters or patience are recommended.
Can it be combined with other indicators?
Yes. Many traders combine Tipu CCI with moving averages, Bollinger Bands, or trend-strength indicators to improve trade accuracy.
Summary
The Tipu CCI Indicator helps traders identify short-term momentum shifts while staying aligned with the overall trend.
Its histogram and optional arrows provide clear visual cues for entries, making it easy to spot bullish and bearish signals quickly.
Traders can use it across multiple timeframes and pairs, making it a flexible tool for intraday and swing trading strategies.


