About the Tops Bottoms Forecasting Indicator
The Tops Bottoms Forecasting Indicator is a specialized technical tool designed to identify potential exhaustion points in price action.
It utilizes a sophisticated calculation method involving Jurik and Laguerre filtering to smooth out price fluctuations and reduce market noise.
The indicator oscillates within a range of 1.1 to -1.1, providing a clear visual representation of when a currency pair is overextended.
By focusing on these extremes, traders can anticipate where a trend might pause or reverse.
This tool is particularly useful for finding high-probability entries in both ranging and trending environments.
It features a built-in smoothing factor specifically engineered to minimize false signals, which is a common issue with standard oscillators.
Rather than relying on simple price averages, the Tops Bottoms Forecasting Indicator looks at deeper volatility cycles.
This allows it to act as a reliable forecaster for traders who want to enter at the early stages of a market turn.
Key Features
Free Download
Download the “Jma Ppo.ex4” MT4 indicator
Key Features
- Uses red histogram bars to signal potential market tops and reversal zones.
- Uses green histogram bars to identify potential market bottoms for buying opportunities.
- Incorporates Jurik and Laguerre filtering for superior price smoothing.
- Includes an adjustable smoothing factor to filter out market noise and false signals.
- Functions across all timeframes from one-minute scalping to weekly trend analysis.
- Provides clear numerical boundaries between 1.1 and -1.1 to define market extremes.
Indicator Chart
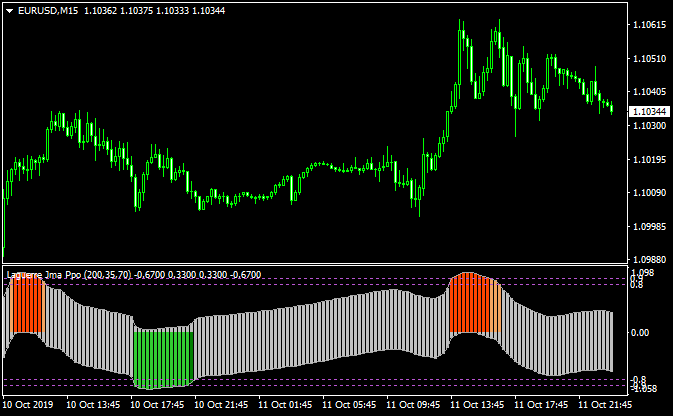
The chart shows the Tops Bottoms Forecasting Indicator detecting price extremes in a separate window.
Red bars rise toward the 1.1 level to indicate that the market has reached a potential peak.
Green bars descend toward the -1.1 level to mark potential troughs.

Guide to Trade with Tops Bottoms Forecasting Indicator
Buy Rules
- Wait for the indicator to print green histogram bars at the bottom of the window.
- Confirm that the overall market trend is bullish using a long-term moving average.
- Look for price to show a rejection of the recent low while the green bars are active.
- Enter a buy position once the first bullish candle closes after the green signal appears.
Sell Rules
- Identify red histogram bars forming at the upper boundary of the indicator.
- Ensure the primary trend is bearish to maintain a high probability of success.
- Wait for the red bars to show signs of peaking near the 1.1 level.
- Execute a sell order at the close of the candle when the top signal is confirmed.
Stop Loss
- Place the stop loss a few pips below the recent swing low for long positions.
- Set the stop loss a few pips above the recent swing high for short positions.
- Adjust the stop loss based on the current ATR to account for market volatility.
Take Profit
- Exit the trade when the histogram reaches the opposite side of the scale.
- Set a profit target at the next major support or resistance level.
- Consider closing the trade if the color of the histogram bars begins to fade.
Tops/Bottoms Forecasting + Simple Linear Regression Forex Scalping Strategy
This scalping strategy uses two indicators: the Tops/Bottoms Forecasting and the Simple Linear Regression indicator.
The Tops/Bottoms Forecasting indicator shows a green histogram to indicate a possible bottom and potential trend reversal for buying, and a red histogram for possible tops signaling a sell.
The Simple Linear Regression indicator draws a channel: an upward-sloping channel indicates a bullish trend, while a downward-sloping channel indicates a bearish trend.
This strategy is designed for fast timeframes like M1 and M5, ideal for scalpers looking for quick trades in the direction of the short-term trend with reversal confirmation.
Buy Entry Rules
- The Simple Linear Regression channel is sloping upward, indicating a bullish trend.
- The Tops/Bottoms Forecasting histogram turns green, signaling a possible bottom.
- Enter a buy trade when both conditions are satisfied.
- Set the stop loss 3–8 pips below the most recent swing low or the bottom edge of the regression channel.
- Set a take profit of 10–20 pips on M1 or 15–30 pips on M5, or use a trailing stop to capture extended moves.
Sell Entry Rules
- The Simple Linear Regression channel is sloping downward, indicating a bearish trend.
- The Tops/Bottoms Forecasting histogram turns red, signaling a possible top.
- Enter a sell trade when both conditions align.
- Set the stop loss 3–8 pips above the most recent swing high or the top of the regression channel.
- Set a take profit of 10–20 pips on M1 or 15–30 pips on M5, or use a trailing stop.
Advantages
- Combines trend direction with reversal signals for more precise entries.
- Histogram colors and channel slope make signals easy to read.
- Fast execution for scalping on lower timeframes.
- Flexible exits: fixed profit targets or trailing stops.
- Can be applied to multiple currency pairs during active sessions.
Drawbacks
- Requires quick reactions due to fast M1/M5 timeframes.
- The channel may lag slightly, leading to late entries or missed trades.
Case Study 1 — EUR/USD on M1
On the EUR/USD M1 chart, the Simple Linear Regression channel sloped upward, indicating a bullish trend.
A green histogram appeared on the Tops/Bottoms Forecasting indicator, signaling a possible bottom.
A buy trade was entered with a stop loss 8 pips below the recent swing low and a take profit of 15 pips.
Price moved higher and hit the take profit target within a few minutes, capturing the scalp successfully.
Case Study 2 — GBP/JPY on M5
On the GBP/JPY M5 chart, the regression channel sloped downward, showing bearish momentum.
The Tops/Bottoms Forecasting histogram turned red, indicating a potential top.
A sell order was placed with the stop loss 10 pips above the recent swing high and a take profit of 25 pips.
Price continued lower, and the trade closed at the target.
Strategy Tips
- Use a broker with low spreads and fast execution for scalping.
- Wait for both the histogram and channel confirmation before entering.
- Consider using a trailing stop to protect profits on extended moves.
- Test the strategy on different currency pairs to adjust stop-loss and take-profit levels according to volatility.
Download Now
Download the “Jma Ppo.ex4” Metatrader 4 indicator
FAQ
How does the Jurik and Laguerre filtering improve the signals?
The Jurik and Laguerre algorithms are designed to provide low-lag smoothing.
In the Tops Bottoms Forecasting Indicator, these filters help the histogram react quickly to price changes while ignoring minor spikes.
This results in cleaner signals that are easier to interpret than standard momentum oscillators that often suffer from lag or excessive noise.
Can I use this indicator for scalping on the M1 timeframe?
Yes, the Tops Bottoms Forecasting Indicator is effective on lower timeframes like the M1 and M5.
However, since scalping involves higher frequency and more noise, you should always use it in conjunction with a trend filter.
Taking only the signals that align with the higher timeframe trend will significantly increase your success rate.
Why does the indicator oscillate between 1.1 and -1.1?
These values represent the mathematical boundaries of the internal calculation.
When the histogram reaches these levels, it signifies that price has moved significantly away from its mean.
Reaching the 1.1 or -1.1 levels suggests that the market is in an extreme state and a reversal or retracement is highly probable.
What is the benefit of the added smoothing factor?
The smoothing factor is a user-adjustable setting that controls how sensitive the indicator is to price movement.
A higher smoothing value will result in fewer, more reliable signals by filtering out small retracements.
A lower value will provide more frequent signals, which may be useful for aggressive traders but increases the risk of false entries.
Summary
The Tops Bottoms Forecasting Indicator provides a robust framework for identifying market turning points.
By combining advanced filtering techniques with a simple visual histogram, it helps traders stay on the right side of the market.
Its greatest strength lies in its ability to highlight exhaustion in the direction of the trend, allowing for precise entries.
While no tool is perfect in every condition, the customization options and smoothing features make this a versatile choice for any forex strategy.
Consistent results are best achieved by merging these signals with sound price action analysis and trend-following filters.


