
About the Trade Day Breakout Indicator
The Trade Day Breakout indicator is a daily range and breakout trading tool designed to highlight potential buy and sell opportunities based on previous trading sessions.
It automatically marks each trading day from Monday to Friday and draws a high–low price box that represents the full range of that session.
By comparing the current day’s price box with the previous day, traders can quickly assess market direction and momentum.
When both the highs and lows shift upward, the indicator signals bullish pressure. When both shift lower, bearish conditions are present.
The Trade Day Breakout indicator works well for traders who focus on intraday breakouts and structured price behavior.
It helps eliminate guesswork by clearly defining daily ranges and breakout levels, making it ideal for systematic trading approaches across all forex pairs and timeframes.
Free Download
Download the “trade-day.mq4” MT4 indicator
Key Features
- Automatically draws daily high and low price boxes.
- Displays the trading day name directly on the chart.
- Identifies bullish and bearish daily trend conditions.
- Highlights breakout levels based on previous day ranges.
- Works well for all currency pairs and timeframes.
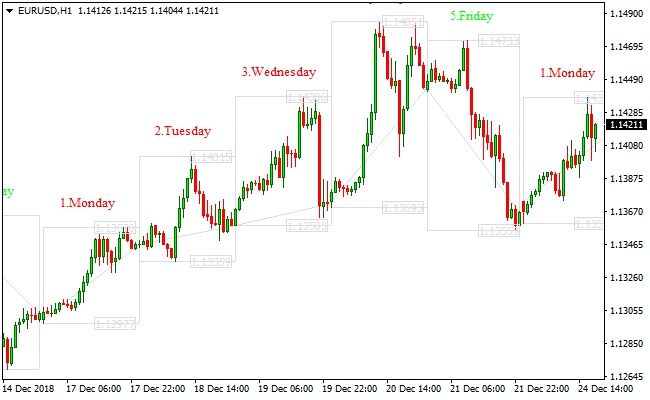
Indicator Chart
The chart shows the Trade Day Breakout indicator with daily high–low boxes plotted on the price chart.
These boxes highlight breakout levels, trend direction, and potential buy or sell zones as price moves beyond prior daily ranges.
Guide to Trade with Trade Day Breakout Indicator
Buy Rules
- Confirm that the current day’s high and low are both higher than the previous day’s box.
- Wait for the price to break above the previous day’s high level.
- Enter a buy trade after a candle closes beyond the breakout level.
- Trade only in the direction of the confirmed upward trend.
Sell Rules
- Confirm that the current day’s high and low are both lower than the previous day’s box.
- Wait for the price to break below the previous day’s low level.
- Enter a sell trade after a candle closes beyond the breakout level.
- Trade only in the direction of the confirmed downward trend.
Stop Loss
- Place the stop loss just inside the current day’s price box.
- Use a fixed pip stop based on the average daily range.
- Position the stop beyond nearby intraday consolidation zones.
- Tighten risk exposure once price moves decisively away from the box.
Take Profit
- Set the take profit at a multiple of the daily range.
- Target the next visible intraday support or resistance zone.
- Trail profits as long as price holds beyond the breakout level.
- Close partial positions as momentum begins to slow.
Trade Day Breakout and BOS CHOCH MT4 Strategy
This strategy combines the Trade Day Breakout MT4 Indicator with the BOS CHOCH MT4 Indicator to identify strong breakout opportunities in the Forex market.
By using the daily breakout box from the Trade Day Breakout indicator and the market structure signals from BOS CHOCH, traders can enter high-probability trades with clear trend direction.
This strategy works best on higher time frames, such as H1, H4, and D1, but it can also be adapted for lower time frames for more active traders.
The strategy is suitable for swing traders, day traders, and breakout-focused scalpers who want a structured approach to capture moves after consolidation.
It leverages market structure analysis to confirm the direction of the breakout, reducing the chance of entering false moves.
Buy Entry Rules
- Confirm that the trend is upward: the low of the current breakout box is higher than the low of the previous day box, and the high is higher than the previous day box.
- Price closes above the BOS CHOCH indicator support level.
- Enter a buy trade at the close of the breakout candle above the box.
- Place the stop loss just below the lower boundary of the breakout box or below the most recent swing low.
- Set take profit at 1.5 to 2 times the risk, or target the next major resistance level.
Sell Entry Rules
- Confirm that the trend is downward: the low of the current breakout box is lower than the low of the previous day box, and the high is lower than the previous day box.
- Price closes below the BOS CHOCH indicator resistance level.
- Enter a sell trade at the close of the breakout candle below the box.
- Place the stop loss just above the upper boundary of the breakout box or above the most recent swing high.
- Set take profit at 1.5 to 2 times the risk, or target the next major support level.
Advantages
- Provides clear trade direction using market structure and breakout confirmation.
- Works well on multiple time frames, allowing flexibility for traders.
- Helps avoid false breakouts by combining two indicators for confirmation.
- Simple rules make it easy to follow for beginner and experienced traders alike.
Drawbacks
- Stop loss placement can sometimes be tight if the breakout box is small.
- Requires monitoring to adjust take profit levels based on market conditions.
- Not ideal for choppy or sideways markets without a clear structure.
Case Study 1
On the EURUSD H4 chart, the breakout box for the day showed a high of 1.1050 and a low of 1.1000.
The low of the current box was higher than the previous day’s low, and the high was higher than the previous day’s high, indicating an upward trend.
Price closed above the BOS CHOCH support level, triggering a buy entry at 1.1060.
Stop loss was set at 1.1000, and take profit at 1.1150.
The trade captured 90 pips over two days.
Case Study 2
On the GBPUSD H1 chart, the breakout box indicated a downward trend.
The current box low was lower than the previous box low, and the high was lower than the previous box high.
Price closed below the BOS CHOCH resistance level.
A sell entry was executed at 1.3120, with a stop loss at 1.3180 and take profit at 1.3020.
The trade captured 100 pips over the next trading session.
Strategy Tips
- Wait for the breakout candle to close above or below the box before entering to avoid false breakouts.
- Check that BOS CHOCH confirms the direction: only take buy trades above support and sell trades below resistance.
- Consider the overall higher time frame trend for additional confirmation. If the higher time frame trend aligns, the breakout is more reliable.
- Adjust take profit levels based on recent swing highs and lows instead of fixed multiples when market volatility is high.
- Combine with volume analysis or candlestick patterns to further confirm breakout strength.
- Use a trailing stop after the trade moves in your favor to capture extended trends while protecting profits.
- For range-bound sessions, skip trades until a clear breakout occurs, reducing the risk of false entries.
- Keep a trading journal of all breakout trades to refine the strategy and identify the most profitable currency pairs and time frames.
Download Now
Download the “trade-day.mq4” Metatrader 4 indicator
FAQ
Which timeframe works best with the Trade Day Breakout indicator?
The indicator works well on intraday timeframes such as M15 and H1, where daily breakouts can be traded with precision.
Does the indicator repaint past breakout levels?
No, once a trading day is completed, its high and low box remains fixed and does not change.
Can this indicator be used for scalping?
Yes, it works great for structured scalping when combined with lower timeframes and strict risk control.
Is the indicator useful during low-volatility sessions?
It performs best during active market sessions when price is more likely to break daily ranges.
Summary
The Trade Day Breakout indicator offers a simple and effective way to trade daily price expansions using clearly defined ranges.
Highlighting trend direction and breakout levels helps traders stay aligned with market momentum.
It works well for traders who prefer rule-based strategies and visual confirmation.


