
About the Trading Levels Forex Indicator
The Trading Levels Forex Indicator for Metatrader 4 helps traders spot potential buy and sell entry points directly on the chart.
Instead of searching for entries manually, the indicator displays important horizontal levels where price may find interest.
These suggested entry levels can guide you toward more confident trade execution.
This indicator plots blue and orange horizontal lines on the main MT4 chart window.
Blue levels are geared toward bullish momentum and potential long-entry zones, while orange levels highlight possible short-entry zones.
Seeing these pre-calculated levels at a glance lets traders plan entries, manage risk and monitor how price reacts around key zones.
Free Download
Download the “Levels.mq4” indicator for MT4
Key Features
- Displays horizontal buy (blue) and sell (orange) entry levels
- Fits all MT4 timeframes and currency pairs
- Helps anticipate potential entry areas before price arrives
- Assists in planning stop loss and take profit placement
- Useful for trend and range-based strategies
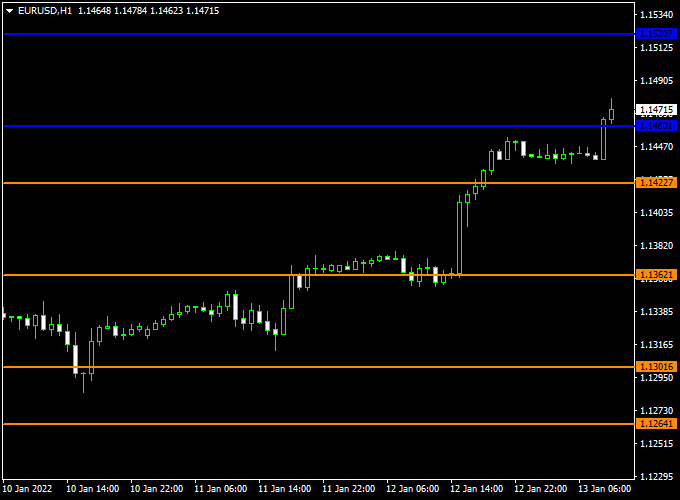
Indicator Chart
The chart below demonstrates the Trading Levels Forex Indicator in action on an MT4 price chart.
Blue lines mark possible buy entry levels and orange lines indicate potential sell entry levels.
Price behavior around these horizontal levels can hint at upcoming directional moves.
Guide to Trade with Trading Levels Forex Indicator
Buy Rules
- Wait for the price to approach a blue entry level
- Enter a buy trade once price shows a bullish candle close above the blue line
- Confirm with a higher timeframe bullish bias when possible
Sell Rules
- Wait for price to approach an orange entry level
- Enter a sell trade once price shows a bearish candle close below the orange line
- Avoid short entries against clear higher timeframe support
Stop Loss
- Place the stop loss just below the next lower support level for buy trades
- Place the stop loss just above the next higher resistance level for sell trades
- If range-bound, widen stops slightly to account for false breakouts
Take Profit
- The first take profit target is near the next major horizontal level
- Move the profit target further toward the next key reaction point on the chart
- Consider partial profits as price approaches strong opposition levels
Practical Tips
- Use the Trading Levels indicator alongside trend direction tools
- Avoid taking signals in choppy or low-volume sessions
- Consider confirming entries with momentum indicators for added confidence
Trading Levels + Super Half Trend Day Trading Strategy for MT4
The Trading Levels Forex Indicator and the Super Half Trend Forex Indicator together create a highly reliable day trading strategy for MT4.
This combination helps traders identify key breakout zones and trade in the direction of the active intraday trend.
The Trading Levels indicator outlines the most important price thresholds, while the Super Half Trend indicator provides precise entry signals through color-coded arrows.
The logic is simple yet powerful: when the price breaks above the first blue horizontal line, it signals a bullish breakout, confirming upward strength.
When the price drops below the orange line, it reflects bearish momentum.
Once the breakout direction is established, the Super Half Trend indicator is used to pinpoint the exact entry moment, ensuring trades are placed with trend confirmation.
This setup works best on the M15 and M30 charts and suits day traders seeking 30–60 pip opportunities during active sessions.
Buy Entry Rules
- Price has broken and is trading above the first blue horizontal line on the Trading Levels indicator.
- A blue arrow appears on the Super Half Trend indicator, confirming a buy signal.
- Enter a buy trade at the open of the next candle after the blue arrow confirmation.
- Set a stop loss 20–25 pips below the nearest swing low or below the blue line.
- Take profit at 40–60 pips or when a red arrow appears signaling a possible reversal.
Sell Entry Rules
- Price has broken and is trading below the orange horizontal line on the Trading Levels indicator.
- A red arrow appears on the Super Half Trend indicator, confirming a sell setup.
- Open a sell position at the next candle open after the signal confirmation.
- Place a stop loss 20–25 pips above the most recent swing high or above the orange line.
- Take profit at 40–60 pips or when a blue arrow forms, suggesting an upward reversal.
Advantages
- Helps traders identify high-probability trades using both trend direction and precise entry signals.
- Reduces emotional trading by relying on clear, rule-based conditions.
- Suitable for multiple timeframes, allowing flexibility for different trading styles.
- It can be applied to various currency pairs, increasing trading opportunities.
- Provides a defined risk-reward structure, helping maintain consistent money management.
Drawbacks
- May miss early momentum moves if waiting for full confirmation signals.
- Requires constant monitoring during active trading sessions to catch intraday setups.
- It can produce false signals during choppy or consolidating market conditions.
- Limited effectiveness in extremely low volatility periods or holidays when price movement is minimal.
Case Study 1 – EUR/USD M15 Chart
During the European session, EUR/USD broke above the first blue horizontal line at 1.0920, confirming bullish sentiment.
Shortly after, the Super Half Trend indicator printed a blue arrow at 1.0925.
A buy trade was opened at 1.0926 with a stop loss at 1.0905 and a take profit at 1.0970.
Over the next few hours, the pair rallied smoothly, reaching the profit target for a 44-pip gain before the appearance of a red arrow.
Case Study 2 – USD/CAD M30 Chart
USD/CAD traded below the orange horizontal line around 1.3625, showing strong bearish momentum.
A red arrow appeared on the Super Half Trend indicator at 1.3620, confirming the entry setup.
A sell trade was opened at 1.3618 with a stop loss at 1.3645 and a take profit at 1.3570.
The trade reached its target within three hours for a 48-pip profit as the trend continued lower through the New York session.
Strategy Tips
- Trade during the London and New York sessions for stronger market momentum.
- Wait for the price to close firmly beyond the Trading Levels lines before taking a signal.
- Use trailing stops once the trade moves 25 pips in profit to lock in gains.
- Avoid trading near major economic events that may cause sudden spikes.
- Focus on trending pairs such as EUR/USD, GBP/JPY, and USD/CAD for optimal results.
This MT4 day trading strategy provides a structured and disciplined approach for traders looking to capture intraday breakouts with confidence.
By combining the directional clarity of the Trading Levels Indicator with the precision entries from the Super Half Trend, traders can capitalize on market momentum while maintaining strict risk control.
Download Now
Download the “Levels.mq4” indicator for Metatrader 4
FAQ
Can I change the colors of the levels?
Yes. You can customize the colors of the entry lines in the indicator settings to suit your visual preferences on MT4.
Does the indicator repaint after levels form?
Once horizontal levels are plotted based on the recent price structure, they do not repaint.
Future price movement may create new levels, but existing lines remain fixed.
Which currency pairs work best?
The indicator works on all Forex currency pairs, but it tends to perform with clearer reactions on major pairs such as EURUSD and GBPUSD due to higher liquidity.
Can I use this indicator on lower timeframes?
Yes. Lower timeframes like M5, M15 and M30 can produce more frequent entry signals, but require cautious filtering to avoid noise.
Summary
The Trading Levels Forex Indicator for MT4 gives traders a useful view of potential buy and sell entry zones through horizontal levels on the chart.
These entry suggestions help with planning trade execution and making more informed decisions as price approaches key areas.
The indicator is simple to apply and effective across multiple timeframes and pairs.
Its value increases when paired with trend direction or momentum tools, which help confirm the strength of possible entries.
By using the Trading Levels indicator consistently, you gain a structured view of where trades may be best placed, improving your overall trade quality and confidence.


