
About the Trend Strength & Correlation Indicator
The Trend Strength & Correlation Indicator for MT4 is a high-level analytical dashboard designed for traders who need to monitor the entire forex market simultaneously.
Instead of flipping through dozens of individual charts, this tool aggregates data for 27 different currency pairs into a single, compact window.
By using the Trend Strength & Correlation Indicator, you can quickly distinguish between a pair that is trending strongly and one that is simply moving within a range.
The tool goes a step further by automatically categorizing pairs into “Long” and “Short” tables, highlighting the instruments with the highest probability of continued movement.
Free Download
Download the “bt-cs-indicator.ex4” MT4 indicator
Key Features
- Monitors and displays the real-time trend strength for 27 currency pairs in one interface.
- Includes a correlation value to help traders avoid redundant exposure on similar moving pairs.
- Features automated tables that sort the best instruments for long and short positions.
- Consolidates complex cross-pair analysis into a simplified mini dashboard.
- Works across all timeframes from the M5 for fast moves to the H4 for long-term trends.
Indicator Chart
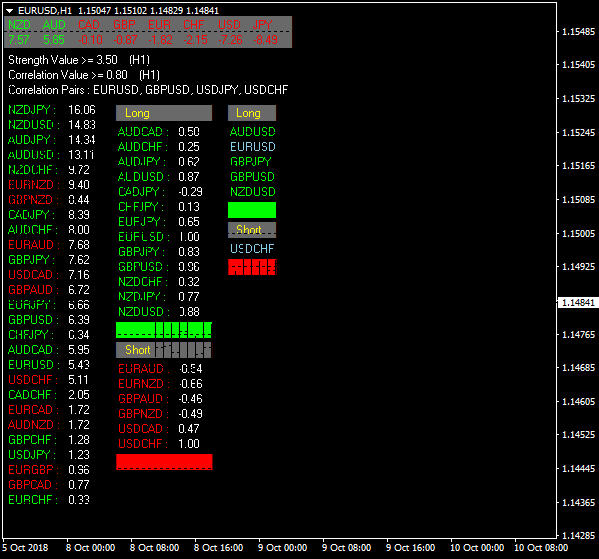
The Trend Strength & Correlation Indicator appears as a professional dashboard on the MT4 platform.
It features a main window showing a list of currency pairs with their respective strength and correlation scores.
Below the main data, separate tables labeled “Long” and “Short” provide immediate suggestions for potential trades.
Guide to Trade with Trend Strength & Correlation Indicator
Buy Rules
- Locate the “Long” table on the indicator dashboard.
- Select a currency pair that is currently listed as a strong buy candidate.
- Verify the upward momentum on the specific pair’s price chart using a trend filter.
- Open a long position once the strength value is confirmed by price action or a secondary tool.
Sell Rules
- Consult the “Short” table within the dashboard interface.
- Identify a pair that is showing significant downward strength.
- Confirm the bearish trend on the main chart to ensure there is no immediate resistance.
- Execute a short trade when the indicator data aligns with your technical analysis.
Stop Loss
- Place the stop loss below the most recent support zone for buy trades.
- Position the stop loss above the previous swing high for sell trades.
- Adjust your exit point based on the average volatility of the specific pair being traded.
Take Profit
- Set a take profit target at the next major psychological level or resistance area.
- Consider closing the trade if the pair drops out of the “Long” or “Short” table on the dashboard.
Forex Trend Strength Correlation + HMA Mega Trend Arrows Strategy
This trading strategy blends the strength analysis of the Trend Strength & Correlation MT4 indicator with the clean entry signals from the HMA Mega Trend Arrows MT4 indicator.
The Trend Strength & Correlation tool displays a dashboard with strength and correlation values for 27 currency pairs.
Pairs listed in the long table show bullish pressure, while pairs listed in the short table show bearish pressure.
This helps traders quickly identify which pairs are most likely to produce strong movements.
The HMA Mega Trend Arrows indicator then provides the actual buy and sell triggers using green arrows for buy setups and red arrows for sell setups.
Together, they form a balanced forex strategy suitable for intraday and swing trading.
Buy Entry Rules
- Select a currency pair that appears in the long table in the Trend Strength & Correlation dashboard.
- Wait for a green arrow to appear from the HMA Mega Trend Arrows indicator.
- Enter a buy trade at the next candle open.
- Place a stop loss just below the nearest recent swing low.
- Set take profit at twice the size of the stop loss to maintain a favorable reward ratio.
Sell Entry Rules
- Choose a currency pair that appears in the short table on the Trend Strength & Correlation dashboard.
- Wait for a red arrow from the HMA Mega Trend Arrows indicator.
- Open a sell position at the next candle open.
- Place a stop loss above the most recent swing high.
- Set take profit at twice the stop loss distance.
Advantages
- The dashboard instantly highlights which currency pairs are currently trending, improving accuracy and saving time.
- The HMA arrows provide clear visual entries that help eliminate hesitation and confusion.
- The combination creates a strong filter, since only high momentum pairs are traded.
- The strategy adapts well to intraday, swing, and multi session trading conditions.
- Traders benefit from high trending efficiency because the dashboard avoids weak or sideways pairs.
Drawbacks
- New traders may feel overwhelmed by the number of pairs displayed on the dashboard.
- Strength readings can fluctuate during low liquidity hours, causing uncertainty.
- HMA arrows may appear slightly late during extremely fast price movements.
- Sudden changes in correlation during news events may affect signal reliability.
- The strategy is less effective on exotic pairs due to unpredictable volatility.
Case Study 1 — AUDCHF, H1
AUDCHF appeared in the long table, showing clear bullish strength.
Shortly afterward, a green arrow appeared at 0.6065.
A buy trade was triggered at the next candle open.
Stop loss was placed at 0.6052 and take profit at 0.6091.
The pair climbed gradually and reached the target for a clean 26 pip gain.
Case Study 2 — GBPJPY, M30
GBPJPY appeared in the short table, signaling strong bearish pressure.
A red arrow formed at 200.85 and a sell trade was placed at the next candle.
Stop loss was set at 201.05 and take profit at 200.45.
Price drifted lower over the next hour and hit the target for a 40 pip profit.
Strategy Tips
- Check whether multiple strong pairs point in the same direction. This often confirms broader market momentum and improves signal reliability.
- When the dashboard shifts a pair from neutral to strong trend, monitor it closely for the next HMA arrow. Early trend formation can offer the best risk-reward setups.
- During periods of tight ranges, wait for the first impulsive breakout candle before trusting any arrow signal.
- Use a fixed trade time window such as the first ninety minutes of London or New York when trends typically form clearly.
- If a pair is at a major daily support or resistance level, wait for a confirming arrow after the market reacts before entering.
- Hold winning trades longer when the dashboard continues to strengthen instead of weakening. This can significantly increase total pip gains.
Download Now
Download the “bt-cs-indicator.ex4” Metatrader 4 indicator
FAQ
How does the correlation value help my trading?
The correlation value in the Trend Strength & Correlation Indicator tells you how closely two pairs move together.
If you see two pairs with a very high correlation, trading both in the same direction effectively doubles your risk on a single move.
This tool helps you select pairs that move independently, ensuring a more balanced and diversified trading portfolio.
Why do I need to confirm these signals with price action?
While the dashboard is excellent at finding momentum, price action helps with timing.
A pair might be listed in the “Long” table, but it could be hitting a major resistance level.
By checking the price chart for a breakout or a pull-back confirmation, you ensure that you are not buying at the very top of a move.
Can I customize which 27 pairs are displayed?
The indicator is pre-configured to track the most liquid and popular currency pairs in the forex market.
This ensures that the data you receive is relevant and based on significant trading volume.
The default list covers the majors and minors that most professional traders focus on daily.
Summary
The Trend Strength & Correlation Indicator is a vital utility for any trader who wants to stay organized and efficient.
It takes the complexity of cross-currency analysis and turns it into an easy-to-use dashboard.
The main benefit is the time saved in scanning the markets, allowing you to focus on the pairs with the highest momentum and the best risk profiles.
Using this tool alongside a solid technical strategy can significantly improve your pair selection.
It ensures you are always trading the strongest currencies against the weakest while managing your overall market correlation.


