About the Trend Wave Forex Signals Indicator
The Trend Wave Forex Signals indicator for MT4 is a technical trading tool designed to deliver straightforward and high-probability buy and sell signals directly on the chart.
By calculating market cycles and identifying areas where price momentum is likely to shift or accelerate, the tool provides traders with a clear edge in volatile conditions.
The indicator plots colored buy and sell dots on the price chart that represent trading opportunities.
These dots appear at the precise moments when the algorithm detects a transition in market sentiment, ensuring that your entries are synchronized with the actual flow of money in the market.
This specialized approach allows you to capture the meat of a trend while maintaining a clean and organized workspace on your MT4 terminal.
Free Download
Download the “TrendWave.mq4” indicator for MT4
Key Features
- Generates buy and sell signals using colored dots.
- Blue dots indicate bullish trade opportunities.
- Yellow dots indicate bearish trade opportunities.
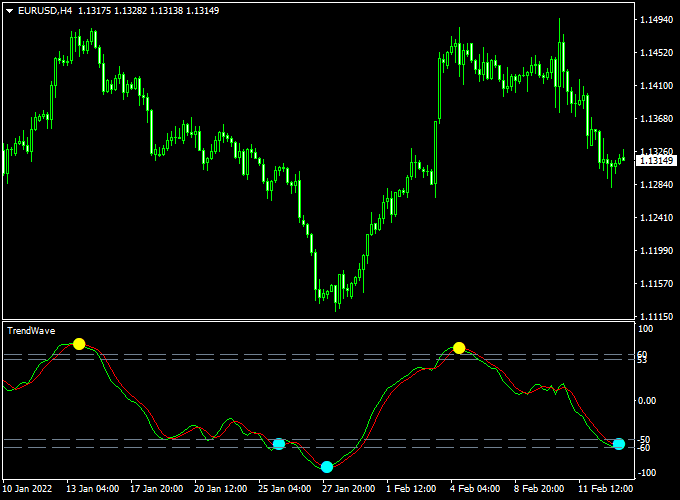
Indicator Chart
The Trend Wave Forex Signals Indicator MT4 chart shows colored dots plotted directly on price candles.
Blue Trend Wave dots highlight potential buy zones, while yellow dots highlight potential sell zones.
This visual approach makes it easy to identify trend direction and signal timing at a glance.

Guide to Trade with Trend Wave Forex Signals Indicator
Buy Rules
- A blue Trend Wave dot appears on the chart.
- The signal aligns with the overall market trend.
- Enter the trade at the close of the signal candle.
Sell Rules
- A yellow Trend Wave dot appears on the chart.
- The broader trend supports bearish movement.
- Enter the trade after the signal candle closes.
Stop Loss.
- Place the stop loss below the most recent pullback for buy trades.
- Place the stop loss above the most recent pullback for sell trades.
- Keep risk consistent by using a fixed account percentage.
Take Profit
- Hold the trade while Trend Wave dots continue in the same direction.
- Exit when price shows clear exhaustion near key market levels.
- Close the trade if the market structure breaks against the position.
Forex Day Trading Strategy MT4: Trend Wave Dots + Gann Trend Oscillator
This day trading strategy combines the Trend Wave Forex Signal Indicator MT4 with the Gann Trend Oscillator MTF Indicator MT4 to give traders clear entry points with trend confirmation.
The Trend Wave indicator generates simple dot signals on the chart: a blue dot suggests a potential buy, while a yellow dot signals a potential sell.
These dots indicate possible reversals or continuation points in the market.
The Gann Trend Oscillator shows colored bars to indicate trend direction, with blue bars for bullish trends and violet bars for bearish trends.
Combining the two ensures that trades are taken only when both the timing and trend align.
This strategy is designed for day traders who focus on intraday moves rather than holding positions overnight.
It works best on 15-minute or 30-minute charts of major currency pairs such as EUR/USD, GBP/USD, USD/JPY, and AUD/USD.
Buy Entry Rules
- The Gann Trend Oscillator shows blue bars, indicating a bullish trend.
- The Trend Wave indicator places a blue dot on the chart.
- Open a buy trade immediately when both conditions are true.
- Stop loss: Place a few pips below the recent swing low or support level.
- Take profit: set a target about 1.5× the stop loss risk or exit when the Gann bars turn violet or the Trend Wave gives a yellow dot.
Sell Entry Rules
- The Gann Trend Oscillator shows violet bars, indicating a bearish trend.
- The Trend Wave indicator places a yellow dot on the chart.
- Open a sell trade when both are aligned.
- Stop loss: a few pips above the recent swing high or resistance level.
- Take profit: target about 1.5× risk or exit when the Gann bars turn blue or the Trend Wave gives a blue dot.
Advantages
- Dual confirmation using trend direction and entry signals increases the probability of successful trades.
- Works well on 15-minute and 30-minute charts, offering multiple trading opportunities per day.
- Helps traders avoid false entries during low-trend or choppy markets.
- Simple rules make it suitable for beginners while remaining effective for experienced traders.
- Adaptable to multiple major currency pairs with high liquidity.
Drawbacks
- Day trading requires constant attention and quick decision-making.
- Stop losses may be triggered by sudden spikes or low-volume noise, even in trending markets.
- Not suitable for traders who prefer long-term swing or position trading.
Case Study 1: GBP/USD 15-Minute Chart
The Gann Trend Oscillator showed blue bars, confirming a bullish trend. Shortly after, the Trend Wave indicator placed a blue dot.
A buy trade was opened at 1.2900 with a stop loss at 1.2890 and a take profit at 1.2915.
Price moved upward during the London session and reached the target, illustrating how combining trend confirmation with entry signals works effectively.
Case Study 2: AUD/USD 30-Minute Chart
The Gann bars turned violet, indicating a bearish trend.
The Trend Wave then placed a yellow dot.
A sell trade was entered at 0.6700 with a stop loss at 0.6712 and a take profit at 0.6688.
Price trended down and hit the target before momentum faded, demonstrating the effectiveness of aligning Trend Wave dots with the Gann trend oscillator.
Strategy Tips
- Use 15-minute or 30-minute charts for clearer signals and better timing.
- Only enter trades when the Trend Wave dot matches the Gann bar direction. Skip trades when they disagree.
- Exit early if the Gann bar color changes or an opposite dot appears.
Download Now
Download the “TrendWave.mq4” indicator for Metatrader 4
FAQ
Does the Trend Wave Forex Signals Indicator MT4 repaint?
The indicator plots signals based on confirmed price data. Once a dot is printed and the candle closes, the signal remains on the chart.
Can the indicator be used as confirmation only?
Yes. Many traders use the Trend Wave dots to confirm trend direction while relying on other tools for precise entries.
Summary
The Trend Wave Forex Signals Indicator MT4 offers a clean and practical approach to trend-based trading.
Its clear visual signals help traders identify buy and sell opportunities without unnecessary complexity.
By working as both a signal generator and a confirmation tool, it fits easily into most trading strategies.
With disciplined risk management and proper confirmation, it can be a valuable addition to any MT4 trading setup.


