
About the TTM Signals Oscillator indicator
The TTM Signals Oscillator indicator for MetaTrader 4 provides oscillator crossover signals in a separate window.
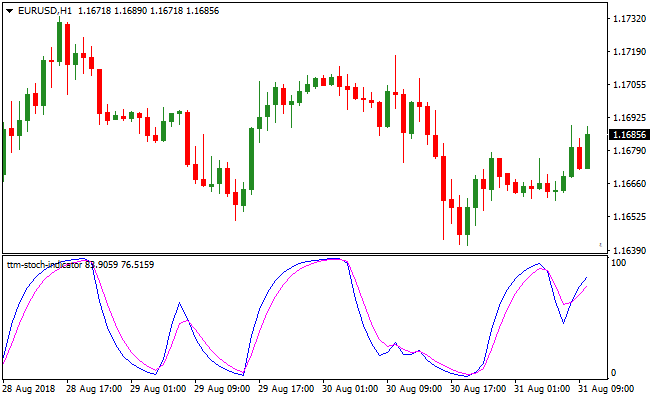
The TTM fluctuates between 0 and 100. The indicator plots two lines (blue and magenta) that form a complete crossover-based trading signal system.
For best trading practices, it is important to closely monitor the 0 and 100 levels.
Levels near 0 indicate oversold market conditions, while levels near 100 indicate overbought market conditions.
The TTM Signals Oscillator can be used as a standalone trading indicator or combined with trend-following indicators.
The default indicator periods can be changed directly from the indicator’s Inputs tab.
Adjusting these settings allows you to better fit the indicator to your needs.
This forex indicator works across all trading styles, currency pairs, and timeframes.
Free Download
Download the “ttm-stoch.mq4” MT4 indicator
Key Features
- Dual line crossover system for immediate entry signals.
- Fixed scale from 0 to 100 to identify overbought and oversold zones.
- Customizable input periods to match different trading frequencies.
- Works as a standalone system or as a filter for trend strategies.
Indicator Chart
The TTM Signals Oscillator indicator chart displays the blue line crossing the magenta line to generate buy and sell signals.
You can see how the indicator identifies reversal points as the lines reach the 0 or 100 levels.
Guide to Trade with the TTM Signals Oscillator indicator
Buy Rules
- Wait for the blue line to cross above the magenta line.
- Ensure the crossover occurs near or above the 0 level.
- Verify that price action shows signs of stabilization.
- Enter a long position once the crossover is confirmed on a closed candle.
Sell Rules
- Wait for the blue line to cross below the magenta line.
- Look for this crossover to happen near or below the 100 level.
- Confirm that the upward momentum has peaked.
- Open a short position at the start of the next candle.
Stop Loss
- Place the stop loss below the recent swing low for buy trades.
- Set the stop loss above the recent swing high for sell trades.
- Maintain a logical buffer to avoid premature exits.
Take Profit
- Exit the trade when an opposing crossover occurs.
- Target the opposite extreme level of the oscillator scale.
- Use a fixed risk-to-reward ratio of at least one to two.
- Close the position if price reaches a major support or resistance zone.
TTM Signals Oscillator and HAMA Jurik Candles MT4 Trend Strategy
This MT4 forex strategy combines momentum-based timing from the TTM Signals Oscillator indicator with clear trend visualization from the HAMA Jurik Candlestick indicator.
The strategy focuses on entering trades during pullbacks within established trends, allowing traders to participate at favorable prices rather than chasing extended moves.
The TTM Signals Oscillator identifies momentum shifts after temporary retracements.
Instead of entering at overextended levels, it waits for the price to cool off and then confirms renewed strength or weakness.
This makes it especially effective when combined with HAMA Jurik Candles, which visually define the dominant trend direction using smooth candlestick coloring.
This strategy works best on M15, M30, and H1 timeframes.
It is suitable for traders who prefer structured trend trading with clear confirmation rules.
It performs well on major and minor currency pairs where price action respects momentum cycles.
Buy Entry Rules
- The HAMA Jurik Candlestick indicator must display blue/white candlesticks, confirming a bullish trend.
- The TTM Signals Oscillator must pull back toward the 0 level.
- A buy signal is confirmed when the blue line crosses back above the magenta line near the 0 level.
- Enter the buy trade at the close of the candle where the bullish crossover is confirmed.
- Stop loss is placed below the most recent swing low or below the last HAMA bullish candle.
- Take profit is set at the next resistance level or using a minimum 1:2 risk to reward ratio.
Sell Entry Rules
- The HAMA Jurik Candlestick indicator must display gray/white candlesticks, confirming a bearish trend.
- The TTM Signals Oscillator must rise back toward the 100 level.
- A sell signal is confirmed when the magenta line crosses back above the blue line near the 100 level.
- Enter the sell trade at the close of the candle where the bearish crossover occurs.
- Stop loss is placed above the most recent swing high or above the last HAMA bearish candle.
- Take profit is set at the next support level or using a minimum 1:2 risk to reward ratio.
Advantages
- Allows entry after pullbacks instead of chasing strong price moves.
- Clear trend direction using smooth candlestick visualization.
- Momentum confirmation reduces false breakout entries.
- Works well across multiple timeframes and currency pairs.
- Encourages disciplined trading with predefined conditions.
Drawbacks
- Signals may appear less frequently during strong one-directional trends.
- Requires patience to wait for oscillator pullbacks.
- Sideways markets can reduce the effectiveness of momentum signals.
- Not optimized for very fast scalping on low timeframes.
Case Study 1
On AUDUSD H1 during the European session, HAMA Jurik Candles remained blue/white, confirming a sustained bullish trend.
After a temporary correction, the TTM Signals Oscillator dropped close to the 0 level.
When the blue line crossed back above the magenta line, a buy trade was executed at candle close.
The stop loss was placed below the recent swing low.
Price resumed higher and reached the take profit level for a gain of approximately 85 pips.
Case Study 2
On USDCAD M30 during the New York session, the HAMA Jurik Candles turned gray/white, indicating bearish conditions.
The TTM Signals Oscillator climbed toward the 100 level during a retracement.
Once the magenta line crossed above the blue line, a sell trade was entered.
The stop loss was set above the recent high.
Price continued lower and hit the profit target, delivering around 52 pips.
Strategy Tips
- Trade only in the direction shown by the HAMA Jurik Candlestick colors to stay aligned with the main trend.
- Use the TTM Signals Oscillator as a timing tool rather than a standalone trend indicator.
- Wait for pullbacks toward key oscillator levels to improve entry quality.
- Confirm entries on candle close to avoid premature signals.
- Focus on liquid pairs during active market sessions for smoother price action.
- Manage risk carefully by keeping stop losses consistent and avoiding overtrading.
Download Now
Download the “ttm-stoch.mq4” Metatrader 4 indicator
FAQ
How do I optimize the TTM Signals Oscillator indicator for scalping?
You should navigate to the inputs tab and reduce the period settings to make the lines more sensitive to fast price changes.
This allows the blue and magenta lines to cross more frequently, capturing smaller momentum shifts on one-minute or five-minute charts.
What do the 0 and 100 levels represent in this system?
The 0 level represents extreme oversold conditions where selling pressure is likely exhausted.
The 100 level represents extreme overbought conditions where buying power is fading.
Can I use the TTM Signals Oscillator indicator to trade gold or indices?
Yes, the mathematical formula behind the crossovers works effectively on any liquid financial instrument.
The indicator adapts to the price volatility of gold and major indices just as it does for standard forex pairs like EUR/USD or GBP/JPY.
Summary
The TTM Signals Oscillator indicator offers a refined approach to momentum trading by simplifying complex price action into a two-line crossover system.
By monitoring the 0 and 100 levels, traders can avoid entering late into exhausted trends and instead find early entries into new moves.
While highly effective on its own, its usability increases when paired with a simple moving average to ensure signals align with the broader market direction.
The ability to tweak input settings makes it a flexible tool for various market conditions.


