About the Ultimate MA Indicator
The Ultimate MA Indicator is a refined trend-following tool designed to deliver smoother and more reliable market direction signals.
By combining Simple, Exponential, and Linear Weighted averages, the Ultimate MA adapts better to changing market conditions.
This approach helps reduce lag while maintaining stability, allowing traders to stay aligned with the dominant trend.
The indicator is plotted directly on the price chart as a single colored line, keeping the chart clean and readable.
Ultimate MA can be used across all currency pairs and timeframes, making it suitable for scalping, intraday trading, and longer-term trend analysis.
Free Download
Download the “ultimate-ma.ex4” MT4 indicator
Key Features
- Combines three moving average calculations into one line.
- Reduces lag compared to traditional single moving averages.
- Helps identify trend direction and continuation phases.
- Functions as a dynamic entry and exit filter.
- Keeps charts uncluttered while improving signal quality.
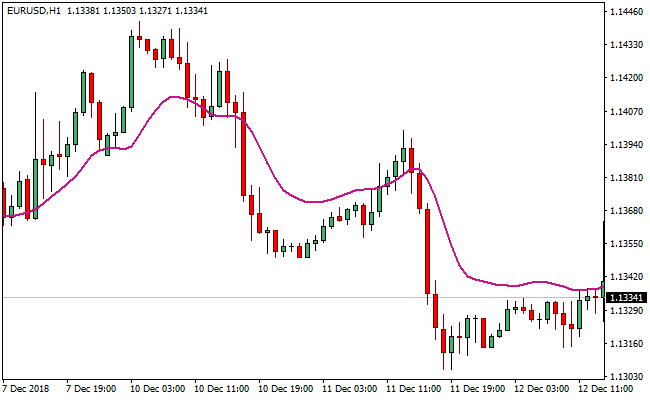
Indicator Chart
The chart shows the Ultimate MA Indicator plotted directly over price action.
The medium violet red line reflects the blended trend direction.
Trade signals appear as price crosses and holds above or below the Ultimate MA line.

Guide to Trade with the Ultimate MA Indicator
Buy Rules
- Confirm the broader market bias is bullish.
- Wait for the price to open above the Ultimate MA line.
- Ensure the candle also closes above the indicator.
- Enter the buy trade on the close of the confirming candle.
Sell Rules
- Confirm the broader market bias is bearish.
- Wait for the price to open below the Ultimate MA line.
- Ensure the candle also closes below the indicator.
- Enter the sell trade once the candle is completed.
Stop Loss Rules
- Place the stop loss beyond the most recent swing level.
- Use a volatility-based stop measured from the recent price range.
- Exit the trade if price reclaims the Ultimate MA line.
Take Profit Rules
- Target the next visible support or resistance area.
- Use a fixed pip profit target of your preference.
- Close the trade when price closes back on the opposite side.
Ultimate Moving Average + Sibbet Demand Index Indicator Forex Day Trading Strategy
This strategy combines the Ultimate MA MT4 Indicator with the Sibbet Demand Index Divergence MT4 Indicator.
The Ultimate MA shows the trend direction: price above the moving average indicates a bullish trend, while price below indicates a bearish trend.
The Sibbet Demand Index plots a histogram: green bars above zero signal buying pressure, and red bars below zero signal selling pressure.
Combining these indicators allows traders to enter trades in the direction of the trend with confirmation from demand/supply momentum.
This setup works best on day trading timeframes such as M15, M30, and H1, and is suitable for traders looking for clear trend-following entries with momentum confirmation.
Buy Entry Rules
- Price must be above the Ultimate MA, indicating a bullish trend.
- The Sibbet Demand Index histogram must be green and above zero.
- Enter a long trade at the close of the candle when the green histogram appears while the price remains above the MA.
- Place a stop loss a few pips below the most recent swing low.
- Exit when the histogram turns red or the price closes below the MA.
Sell Entry Rules
- Price must be below the Ultimate MA, indicating a bearish trend.
- The Sibbet Demand Index histogram must be red and below zero.
- Enter a short trade at the close of the candle when the red histogram appears while the price remains below the MA.
- Place a stop loss a few pips above the most recent swing high.
- Exit when the histogram turns green or the price closes above the MA.
Advantages
- Clear trend filter using the Ultimate MA.
- Momentum confirmation from the Sibbet Demand Index reduces false entries.
- Suitable for day trading on multiple timeframes.
- Well-defined stop loss and exit rules improve risk management.
- Works across various currency pairs.
Drawbacks
- In ranging markets, the MA may give misleading trend signals.
- The histogram may lag during sharp price movements.
- Exits based solely on histogram reversal may give back part of the profit in slow trends.
- Requires monitoring to avoid trades during low-volume or consolidating sessions.
Example Case Study 1
On EUR/JPY H1, the price remained above the Ultimate MA, showing an uptrend.
The Sibbet Demand Index histogram turned green, signaling a buy.
A long trade was entered at candle close with a stop loss 10 pips below the swing low.
The histogram remained green, and the trade was closed when the price closed below the MA, netting a profit of 25 pips.
Example Case Study 2
On GBP/USD M30, the price stayed below the Ultimate MA, signaling a downtrend.
The histogram turned red, confirming a sell signal.
A short position was taken with a stop loss 8 pips above the recent swing high.
The price moved lower, and the trade was exited when the histogram turned green, resulting in an 18-pip gain.
Strategy Tips
- Focus on active sessions such as London and New York for stronger trend and momentum signals.
- Avoid taking trades when the price is too close to the MA and the histogram is weak or fluctuating.
- Adjust stop losses according to the volatility of the currency pair.
- Wait for confirmation of both trend and histogram before entering a trade to reduce false signals.
Download Now
Download the “ultimate-ma.ex4” Metatrader 4 indicator
FAQ
How is the Ultimate MA different from standard moving averages?
It blends three moving average calculations into one weighted output, offering smoother and more adaptive trend tracking.
Can the Ultimate MA replace multiple moving averages?
Yes, it is designed to reduce the need for stacking several averages on the chart.
Summary
The Ultimate MA Indicator offers traders a balanced way to follow trends without overcrowding their charts.
Its blended calculation method improves responsiveness while maintaining smooth price tracking.
This makes it a practical alternative to using multiple moving averages for confirmation.
The Ultimate MA can serve as a dependable foundation for many trading strategies.


