About the Ultimate Oscillator Indicator
The Ultimate Oscillator for MetaTrader 4 is a signal-based trading tool that delivers clear buy and sell opportunities through an integrated visual display on the bottom of the chart.
It is designed to analyze market conditions quickly and present trend information in a practical way without overcrowding the chart.
This indicator evaluates price action across three different timeframes simultaneously, combining short, medium, and long-term momentum into a single, unified value to reduce the volatility common in other oscillators.
For every market movement, it shows whether the momentum is reaching exhaustion points or if the trend is gaining strength.
Once conditions align and the indicator reaches specific overbought or oversold zones, it highlights a precise entry signal, helping traders act with confidence.
Free Download
Download the “Ultimate_Oscillator.mq4” indicator for MT4
Key Features
- Calculates momentum using three different timeframes to minimize false signals.
- Provides clear visual levels at 30 and 70 to identify market extremes.
- Identifies potential trend reversals through overbought and oversold zones.
- Helps filter out market noise better than standard single-period oscillators.
Indicator Chart
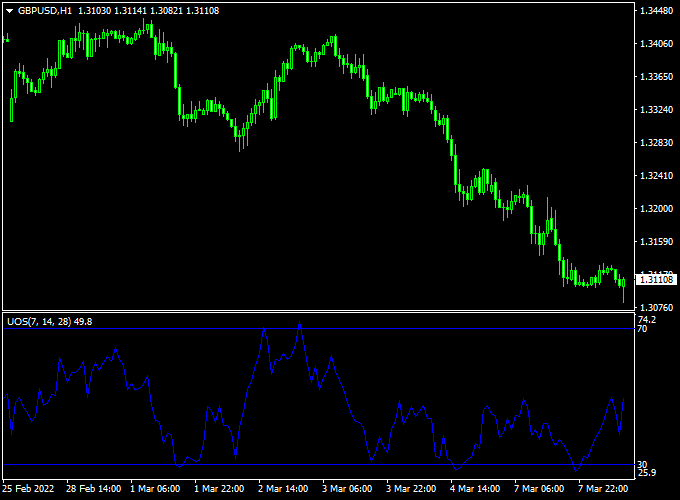
The chart features the Ultimate Oscillator indicator displayed in a sub-window below the main price action.
You can see the oscillator line moving between the 0 and 100 levels, with specific horizontal lines marking the 30 and 70 boundaries.
When the line dips below 30, it indicates an oversold condition, while a rise above 70 suggests an overbought market.

Guide to Trade with the Ultimate Oscillator Indicator
Buy Rules
- Monitor the indicator until it drops below the 30 level.
- Wait for the oscillator to cross back above 30 from below.
- Ensure the underlying trend is upward before opening a buy position.
Sell Rules
- Monitor the indicator until it rises above the 70 level.
- Wait for the oscillator to cross back below 70 from above.
- Ensure the underlying trend is downward before opening a sell position.
Stop Loss
- For buy trades, place the stop loss below the recent swing low.
- For sell trades, place the stop loss above the recent swing high.
Take Profit
- Exit the trade when the oscillator reaches the opposite extreme level.
- Consider closing the position if a bearish or bullish divergence appears.
- Aim for a risk-to-reward ratio of at least one to two for steady growth.
Ultimate Oscillator Indicator + XTC Forex Trend Scalping Strategy for MT4
This scalping strategy combines the Ultimate Oscillator Indicator for MT4 with the XTC Forex Trend Indicator for MT4 to pinpoint short-term market reversals that align with the main intraday
trend.
The combination of momentum and trend visualization provides a balanced approach for traders who aim to capture small but consistent profits during active market sessions.
It works especially well on the M5 and M15 time frames, making it suitable for day traders and scalpers who prefer fast-paced environments.
The Ultimate Oscillator identifies oversold and overbought zones, helping traders find exhaustion points in price momentum.
Meanwhile, the XTC Forex Trend Indicator shows the market direction with a color-coded histogram — blue bars for bullish momentum and red bars for bearish movement.
When the oscillator and histogram agree, the probability of a successful scalp increases significantly.
Buy Entry Rules
- Wait until the Ultimate Oscillator crosses back above the 30 level from below, indicating the end of bearish pressure.
- Confirm that the XTC Forex Trend histogram turns blue, showing an upward trend.
- Enter a buy position at the opening of the next candle after confirmation.
- Set a stop loss 10–15 pips below the recent swing low or the nearest support level.
- Take profit after 20–30 pips or when the oscillator approaches the 70 level again.
Sell Entry Rules
- Wait until the Ultimate Oscillator crosses back below the 70 level from above, signaling exhaustion of bullish momentum.
- Confirm that the XTC Forex Trend histogram is red, showing a clear sell trend.
- Open a sell position at the next candle close after both confirmations align.
- Place a stop loss 10–15 pips above the last swing high or resistance zone.
- Take profit after 20–30 pips or when the oscillator drops near the 30 level again.
Advantages
- Combines trend and momentum, reducing false countertrend entries.
- Adaptable to all major currency pairs with low spreads.
- Works well during high volatility sessions, such as the London and New York overlap.
Drawbacks
- Requires quick execution and discipline in managing small stop losses.
- Limited reward potential per trade compared to swing systems.
- Performance may vary on pairs with wider spreads or less liquidity.
Case Study 1: USD/JPY 5-Minute Chart
On USD/JPY, during the London session, the Ultimate Oscillator crossed above the 30 line from oversold territory while the XTC Forex Trend histogram turned blue.
A buy position was taken at 150.45 with a 12-pip stop loss.
Within 40 minutes, the price reached 150.70, generating a quick 25-pip gain.
The trade was exited as the oscillator neared 70, confirming profit-taking momentum.
Case Study 2: EUR/GBP 15-Minute Chart
On EUR/GBP, the Ultimate Oscillator crossed below 70 while the XTC histogram remained red, signaling a bearish continuation.
A sell order was entered around 0.8460 with a stop loss at 0.8473.
Over the next hour, the pair dropped to 0.8438, capturing a clean 22 pips.
The oscillator later bounced near 30, prompting a timely exit from the scalp trade.
Strategy Tips
- Focus on trading during active hours when spreads are tight and liquidity is high.
- Avoid taking trades against the histogram color, even if the oscillator gives a signal.
- Use a trailing stop once the price moves 15 pips in your favor to protect profits.
- Monitor multiple pairs, but focus on only the strongest trending ones for the best results.
Download Now
Download the “Ultimate_Oscillator.mq4” indicator for Metatrader 4
FAQ
What is the best way to confirm the underlying trend?
While the Ultimate Oscillator identifies the entry, you should use a higher timeframe or a moving average to determine the main trend.
For example, if the price is above the 200-period moving average, only look for buy signals when the indicator crosses above 30.
This ensures you are always trading in the direction of the dominant market force.
Can this indicator be used for scalping on M1 and M5?
Yes, the Ultimate Oscillator is quite effective for scalping because it reduces the “choppiness” of lower timeframes.
By weighting multiple periods, it filters out the minor price wiggles that often trigger false signals on the 1-minute chart.
Scalpers find it useful for catching quick reversals while the overall trend remains in their favor.
Summary
The Ultimate Oscillator indicator provides a refined approach to momentum trading by addressing the common flaws found in traditional oscillators.
Its multi-timeframe calculation offers a level of stability and clarity that helps traders identify high-probability reversal points with greater accuracy.
Simplifying complex momentum data into a single line with clear thresholds removes much of the guesswork from technical analysis.
Incorporating this tool into your strategy allows for a more disciplined entry and exit process.


