
About the Var Moving Average Indicator
The Var Moving Average indicator for MetaTrader 4 is an advanced trend-following tool that improves upon the limitations of traditional moving averages.
It utilizes a variable smoothing calculation that allows it to react more quickly to price changes while remaining stable during choppy market conditions.
This indicator tracks the current market flow and displays its findings directly on the price candles using a series of color-coded dots.
By filtering out minor price fluctuations, it helps you stay focused on the dominant market direction.
When the trend shifts to the upside, the indicator plots green dots below the price. Conversely, when the bears take control, red dots appear above the price.
Its primary benefit is the reduction of lag, which is a common problem with standard exponential or simple moving averages.
Traders use these dots to identify the exact moment a trend begins to accelerate or when a reversal is likely to occur.
Free Download
Download the “var moving average.mq4” indicator for MT4
Key Features
- The indicator provides immediate trend direction through a simple green and red color system.
- It uses a variable smoothing algorithm that adjusts to changing market volatility levels.
- Dots are plotted directly on the main chart for easy alignment with price action.
- It acts as both a trend filter and an entry trigger for various trading styles.
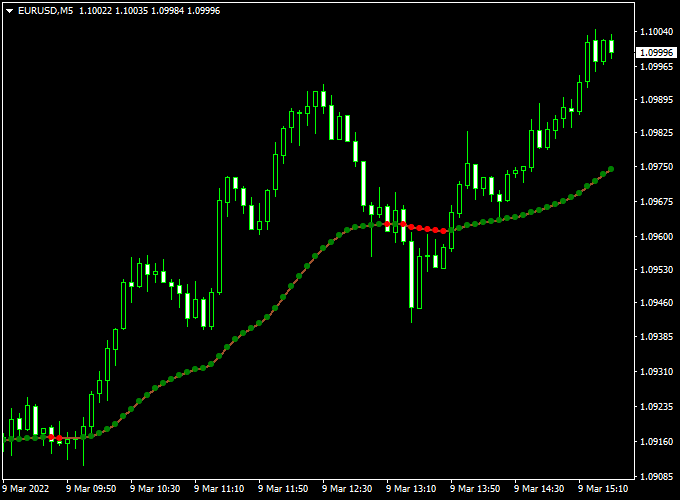
Indicator Chart
The chart illustrates the Var Moving Average indicator for MT4 applied to a trending currency pair.
The green dots appearing below the candles indicate a sustained bullish move, while the transition to red dots above the candles signals a bearish shift.
Guide to Trade with Var Moving Average Indicator
Buy Rules
- Monitor the price chart for the appearance of the first green dot.
- Ensure the green dot is positioned below the current price candle.
- Enter a long position at the start of the next candle after the green dot is confirmed.
- Verify that the general market trend is not hitting a major resistance zone.
Sell Rules
- Watch for the first red dot to appear on the trading chart.
- Confirm that the red dot is sitting above the price candle.
- Open a short position as soon as the signal candle closes and the red dot remains.
- Check that the market has enough room to move lower without immediate support levels.
Stop Loss
- Place the stop loss for a buy trade a few pips below the most recent green dot.
- Set the stop loss for a sell trade a few pips above the most recent red dot.
- Move the stop loss to breakeven once the price moves significantly in your favor.
Take Profit
- Close the position when the indicator prints a dot of the opposite color.
- Alternatively, target a fixed profit level based on a specific risk-to-reward ratio.
- Exit the trade if price action shows signs of a sharp reversal against the dots.
VAR Moving Average + 2 Moving Average Arrow MT4 Scalping Strategy
This scalping strategy combines the VAR Moving Average Indicator for MT4 with the 2 Moving Average Arrow Forex Indicator for MT4.
It is designed for very short-term trades on M1 and M5 charts, helping traders capture quick price moves with minimal risk.
The VAR Moving Average shows the overall trend using green and red dots, while the 2 Moving Average Arrow provides precise entry points with blue (buy) and purple (sell) arrows.
How This Strategy Works
The VAR Moving Average filters out trades against the trend by displaying green dots for an uptrend and red dots for a downtrend.
The 2 Moving Average Arrow signals entries in the direction of the trend.
By combining these indicators, traders can focus on high-probability scalping setups that occur in alignment with the current trend, reducing false signals and enhancing trade timing.
Buy Entry Rules
- Ensure the VAR Moving Average dots are green, indicating a bullish trend.
- Wait for the 2 Moving Average Arrow to display a blue arrow (buy signal).
- Enter a buy trade at the close of the candle that generated the blue arrow.
- Place a stop loss below the most recent swing low, typically 5–10 pips on M1 and 8–12 pips on M5 charts.
- Take profit after 10–20 pips or when the VAR Moving Average dots turn red.
Sell Entry Rules
- Ensure the VAR Moving Average dots are red, indicating a bearish trend.
- Wait for the 2 Moving Average Arrow to display a purple arrow (sell signal).
- Enter a sell trade at the close of the candle that generated the purple arrow.
- Place a stop loss above the most recent swing high, typically 5–10 pips on M1 and 8–12 pips on M5 charts.
- Take profit after 10–20 pips or when the VAR Moving Average dots turn green.
Advantages
- Quick entries and exits are suitable for high-frequency scalping.
- Clear visual signals reduce confusion and allow fast decision-making.
- Works well on volatile pairs like GBP/USD, EUR/JPY, and AUD/USD.
- Trend filter (VAR Moving Average) reduces trades against market momentum.
Drawbacks
- Spreads and slippage can significantly affect profitability on M1 charts.
- High-frequency trading can be stressful and demands quick execution.
- Not suitable for long-term or swing trading; strictly for scalping.
Case Study 1 – EUR/USD M1 Chart
During the London session, the VAR Moving Average showed green dots on EUR/USD, confirming a bullish trend.
Shortly after, the 2 Moving Average Arrow displayed a blue arrow at 1.1012.
A buy trade was entered with a stop loss at 1.1005 and a target of 1.1022.
Price reached the target within 12 minutes, yielding +10 pips.
Case Study 2 – GBP/JPY M5 Chart
On GBP/JPY, the VAR Moving Average dots turned red, indicating a downtrend.
The 2 Moving Average Arrow displayed a purple arrow at 187.45.
A sell position was taken with a stop loss at 187.60 and a take profit at 187.25.
The price moved quickly in favor, reaching the target for a 20-pip gain in 25 minutes.
Strategy Tips
- Trade only during active sessions, such as London and New York, for stronger momentum.
- Focus on highly liquid pairs to reduce slippage and spread costs.
- Use a small fixed lot size due to the fast nature of M1 scalping.
- Avoid trading during major news releases to prevent sudden spikes and stop-loss hits.
- Exit early if the trend shows signs of reversing before reaching the target.
Download Now
Download the “var moving average.mq4” indicator for Metatrader 4
FAQ
How does this variable calculation differ from a standard SMA?
The Var Moving Average uses a dynamic smoothing factor that changes based on price activity.
A standard SMA treats all data points equally, which often causes it to lag behind fast moves.
This version tightens up during high volatility to give you a faster entry signal.
Can I use the Var Moving Average dots for scalping?
Yes, many traders use this indicator on the 1-minute or 5-minute timeframes for scalping.
Because the dots react quickly to price changes, they can help you capture small momentum bursts that occur throughout the trading session.
What are the best settings for the Var Moving Average?
The default settings are balanced for most pairs, but you can increase the period if you want a smoother line that ignores more noise.
A smaller period setting will make the dots change color more often, which is useful for aggressive entries.
Summary
The Var Moving Average indicator for MetaTrader 4 offers a modern approach to trend following by reducing the delay found in older indicators.
Its use of red and green dots makes it easy to read even during fast-moving market sessions.
The indicator is particularly useful for traders who want to catch the beginning of a new trend without waiting for a slow moving average crossover.
While it is a robust tool on its own, it works exceptionally well when paired with price action or support and resistance levels.


