About the Var Moving Average Indicator
The Var Moving Average indicator is a trend-following tool built for traders who prefer staying aligned with sustained market moves.
This indicator adapts to price behavior and highlights directional changes using colored dots plotted along a central line.
The signals appear directly on the price chart as a sienna-colored line, with green and red dots placed along it.
These dots reflect bullish and bearish conditions based on the internal logic of the variable moving average.
Green dots signal upward momentum, while red dots signal downward pressure.
This presentation allows traders to assess trend direction at a glance without cluttering the chart.
Its adaptive nature helps reduce lag during trending markets while remaining stable enough to avoid excessive noise.
Free Download
Download the “var-moving-average.ex4” MT4 indicator
Key Features
- An adaptive moving average that responds to market conditions.
- Green and red dots for fast trend identification.
- Overlay display directly on the price chart.
- Suitable for trend trading and momentum-based strategies.
Indicator Chart
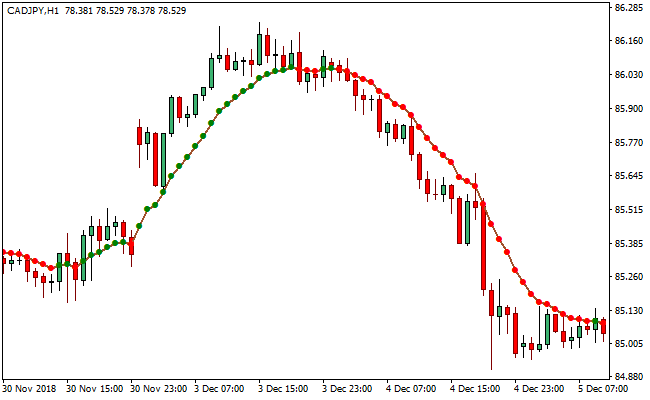
The Var Moving Average indicator chart shows a smooth sienna line following price action, with colored dots plotted along it.
Green dots indicate bullish phases where price is trending higher, while red dots highlight bearish phases.
These visual signals help traders stay positioned in the dominant trend.

Guide to Trade with the Var Moving Average Indicator
Buy Rules
- Wait for the dots on the sienna line to turn green.
- Confirm that price is trading above the moving average line.
- Check the higher timeframe direction for bullish alignment.
- Enter the trade at the close of the signal candle.
Sell Rules
- Wait for the dots on the sienna line to change to red.
- Ensure price is trading below the moving average line.
- Confirm bearish bias on a higher timeframe.
- Enter the trade after the signal is fully formed.
Stop Loss
- Place the stop loss 3 pips below the most recent swing low for buy trades.
- Place the stop loss 3 pips above the most recent swing high for sell trades.
- Alternatively, use a fixed ATR-based stop to match volatility.
- Exit early if dots flip color shortly after entry.
Take Profit
- Target the next major support or resistance level.
- Trail the stop loss as long as the dot color remains unchanged.
- Close part of the position after a strong impulse move.
- Exit fully when the dots change to the opposite color.
VAR Moving Average Indicator + X Points Scalper Forex Strategy
This strategy combines the VAR Moving Average MT4 Indicator with the X Points Forex Scalper MT4 Indicator.
The VAR Moving Average shows trend direction with a green dotted line for bullish trends and a red dotted line for bearish trends.
The X Points indicator provides entry signals with blue arrows for buys and red arrows for sells.
Using both indicators together helps identify trend-aligned scalping opportunities with precise entry points.
This strategy is designed for short-term timeframes such as M1 and M5 and is suitable for traders looking to capture quick moves with minimal risk by following the trend.
Buy Entry Rules
- The VAR Moving Average line must be green dotted, indicating a bullish trend.
- The X Points indicator must show a blue arrow, signaling a buy.
- Enter a long trade at the close of the candle where the blue arrow appears while the green dotted line remains bullish.
- Place a stop loss a few pips below the most recent swing low.
- Take profit when the VAR Moving Average turns red or the X Points blue arrow disappears.
Sell Entry Rules
- The VAR Moving Average line must be red dotted, indicating a bearish trend.
- The X Points indicator must show a red arrow, signaling a sell.
- Enter a short trade at the close of the candle where the red arrow appears while the red dotted line remains bearish.
- Place a stop loss a few pips above the most recent swing high.
- Take profit when the VAR Moving Average turns green or the X Points red arrow disappears.
Advantages
- Clear visual trend filter from VAR Moving Average.
- X Points arrows provide precise entry signals.
- Suitable for M1 and M5 scalping with multiple trading opportunities.
- Stop loss and take profit rules are well-defined and easy to follow.
- Helps avoid counter-trend trades and reduces noise.
Drawbacks
- The trend line may change direction quickly in choppy markets, giving false signals.
- X Points arrows can generate whipsaw entries without trend confirmation.
- The strategy requires focus and fast execution on short timeframes.
Example Case Study 1
On EUR/USD M1 during the London session, the VAR Moving Average showed a green dotted line.
Shortly after, a blue X Points arrow appeared, signaling a buy.
A long position was entered at candle close, with a stop loss 5 pips below the swing low.
The trade moved in the direction of the trend and was closed when the VAR Moving Average line turned red, resulting in a 10-pip profit.
Example Case Study 2
On GBP/JPY M5 during New York hours, the VAR Moving Average turned red dotted, signaling a bearish trend.
A red X Points arrow appeared, indicating a sell. A short trade was entered at candle close, with a stop loss 7 pips above the recent swing high.
Price moved down steadily, and the trade was closed when the blue dotted line appeared, locking in a 15-pip profit.
Strategy Tips
- Trade during active sessions like London and New York to improve trend and entry reliability.
- Avoid taking trades when the VAR Moving Average line is flat or indecisive.
- Use small positions due to tight stops in scalping to manage risk.
- Wait for the X Points arrow to appear only after the trend line is clearly established.
- Keep a record of which currency pairs, such as USD/JPY or AUD/USD, respond best to this setup on M1 and M5 charts.
Download Now
Download the “var-moving-average.ex4” Metatrader 4 indicator
FAQ
What makes the Var Moving Average different from a standard MA?
The Var Moving Average adjusts its calculation based on market behavior, allowing it to respond faster during trends and remain smoother during consolidation.
Is the indicator suitable for scalping?
Yes, it can be used on lower timeframes, but it performs best when markets are trending rather than ranging.
Can it be combined with other indicators?
Yes, many traders pair it with momentum tools or support and resistance analysis for added confirmation.
Summary
The Var Moving Average indicator offers a practical way to follow market trends using adaptive logic and simple visual signals.
Its colored dots make it easy to stay on the right side of momentum without overanalyzing price data.
Suitable for multiple trading styles and markets, it provides flexibility while maintaining clarity.
With disciplined execution and sensible risk management, the indicator can support consistent trend-based trading decisions.


