
About the Variation Oscillator Indicator
The Variation Oscillator indicator for MetaTrader 4 is a specialized technical tool designed to measure short-term market sentiment.
It operates as a momentum-based oscillator that focuses on price volatility and directional shifts.
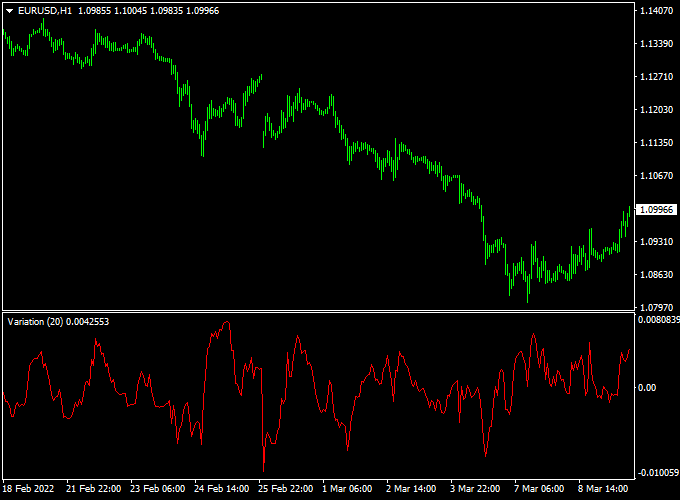
The indicator is displayed in a dedicated window below the main price chart, appearing as a single red line that moves around a central zero point.
By tracking how this line fluctuates, traders can quickly determine whether the prevailing market force is bullish or bearish.
This indicator is particularly effective for those who focus on high-frequency trading or scalping.
It filters out the broader market noise to highlight immediate changes in price velocity.
When the red line is above the zero level, it suggests that buyers are currently in control of the short-term momentum.
Conversely, when the line drops below zero, the bearish sentiment is gaining traction.
Free Download
Download the “variation oscillator.mq4” indicator for MT4
Key Features
- The indicator utilizes a central zero-level crossover system to define market bias.
- It features a high-sensitivity red line that reacts quickly to minor price changes.
- The tool is optimized for short-term targets ranging between 5 and 15 pips.
- The oscillator works across various currency pairs, particularly during the London and New York sessions.
Indicator Chart
The chart shows the Variation Oscillator indicator for MT4 positioned at the bottom of the screen.
The red line provides signals as it crosses the horizontal zero level.
When the line moves from negative to positive territory, it identifies a bullish entry point.
When it moves from positive to negative territory, it marks a bearish shift.
This setup helps traders align their entries with the immediate momentum of the market.
Guide to Trade with the Variation Oscillator Indicator
Buy Rules
- Wait for the red oscillator line to be positioned below the zero level.
- Observe the line as it moves upward and crosses back above the zero level.
- Ensure the current price action shows a bullish candle or a support bounce.
- Enter a buy trade immediately after the zero-line crossover is confirmed.
Sell Rules
- Monitor the red oscillator line while it is trending above the zero level.
- Identify the moment the line turns downward and crosses below the zero level.
- Confirm that the broader market sentiment or recent candles show bearish pressure.
- Open a sell position once the red line successfully breaks into negative territory.
Stop Loss
- For long positions, place the stop loss below the most recent local support or swing low.
- For short positions, set the stop loss above the nearest resistance level or swing high.
- Keep the stop loss tight to maintain a favorable risk-to-reward ratio for scalping.
Take Profit
- Aim for a profit target of 5 to 15 pips per trade in line with the scalping nature of the tool.
- Alternatively, exit the trade when the red line begins to flatten or turn back toward the zero level.
- You may also close the position if an opposite crossover signal occurs on the chart.
Variation Oscillator + Guppy MA Signal MT4 Forex Scalping Strategy
This scalping strategy combines the Variation Oscillator Indicator for MT4 with the Guppy Multiple Moving Average Signal Indicator for MT4.
It is designed for very short-term trades on M1 and M5 charts, helping traders capture quick price moves with minimal risk.
The Variation Oscillator identifies momentum shifts when crossing above or below zero, while the Guppy MA confirms the trend using blue (bullish) and orange (bearish) lines.
How This Strategy Works
The Variation Oscillator generates early momentum signals, and the Guppy MA filters trades to ensure they align with the overall trend.
Trades are only taken when both indicators are in agreement, reducing false signals and improving the probability of successful scalping setups.
Buy Entry Rules
- Wait for the Variation Oscillator to cross back above zero, indicating bullish momentum.
- Confirm that the Guppy MA line is blue, indicating an uptrend.
- Enter a buy trade at the close of the confirmation candle.
- Set a stop loss below the recent swing low (5–10 pips for M1, 10–20 pips for M5).
- Take profit at 10–20 pips on M1 or 20–30 pips on M5, or exit if the Guppy MA trend turns orange.
Sell Entry Rules
- Wait for the Variation Oscillator to cross back below zero, indicating bearish momentum.
- Confirm that the Guppy MA line is orange, indicating a downtrend.
- Enter a sell trade at the close of the confirmation candle.
- Set a stop loss above the recent swing high (5–10 pips for M1, 10–20 pips for M5).
- Take profit at 10–20 pips on M1 or 20–30 pips on M5, or exit if the Guppy MA trend turns blue.
Advantages
- Clear visual signals allow fast decision-making for scalping.
- Combines momentum and trend confirmation for higher-probability trades.
- Works well on liquid pairs like EUR/USD, GBP/USD, USD/JPY, and EUR/JPY.
- Short-term trades reduce exposure to overnight risk.
Drawbacks
- Requires constant monitoring due to M1 and M5 timeframes.
- Spreads and slippage can affect profits in very short trades.
- Major news events may invalidate signals quickly.
Case Study 1 – USD/JPY M1 Chart
During the London session, USD/JPY showed the Variation Oscillator crossing above zero at 149.45 while the Guppy MA line turned blue, confirming a bullish trend.
A buy trade was entered at 149.47, stop-loss at 149.38, and target at 149.62.
The trade reached the target within 10 minutes for +15 pips.
Case Study 2 – EUR/GBP M5 Chart
On EUR/GBP, the Variation Oscillator crossed below zero at 0.8540 while the Guppy MA line turned orange, confirming a bearish trend.
A sell trade was entered at 0.8538, stop-loss at 0.8550, and take profit at 0.8520.
The price reached the target in 20 minutes for +18 pips.
Strategy Tips
- Focus on major or highly liquid pairs to reduce slippage and spread costs.
- Use a small fixed lot size due to the fast nature of scalping.
- Exit early if the Guppy MA trend or oscillator shows signs of reversal.
- Keep a trading journal to track results, refine settings, and improve pair selection.
Download Now
Download the “variation oscillator.mq4” indicator for Metatrader 4
FAQ
Can this indicator be used on higher timeframes like the H4 or Daily?
While it is primarily built for scalping and short-term analysis on M5 or M15 charts, it can function on higher timeframes.
On these charts, the signals will represent broader shifts in weekly or monthly sentiment rather than quick intraday bursts.
Why does the red line move so frequently across the zero level?
The indicator is designed to be highly sensitive to price changes.
This frequent movement is useful for scalpers who need to see every minor shift in sentiment.
To reduce “whipsaws,” it is recommended to trade only in the direction of the primary trend.
Is the Variation Oscillator a lagging indicator?
All oscillators use past price data, but the Variation Oscillator is tuned to minimize lag.
It focuses on the most recent price candles to provide a near real-time look at how market sentiment is shifting from one side to the other.
Summary
The Variation Oscillator indicator for MetaTrader 4 is a robust tool for traders who prioritize speed and momentum.
Its simple zero-line crossover mechanism takes the guesswork out of determining market sentiment.
Because it is lightweight and responsive, it fits perfectly into a scalping strategy aimed at capturing small, frequent gains.
While it provides high-quality signals during volatile sessions, users should be mindful of flat markets where the line may oscillate too frequently.
Combining this tool with a trend filter or volume indicator can significantly enhance its effectiveness in everyday trading.


