
About the Volatility Pivot Buy Sell Indicator
The Volatility Pivot Buy Sell indicator for MT4 is a versatile tool that identifies buy and sell trading opportunities using volatility and dynamic pivot points.
Price action above the pivot suggests an uptrend, while price action below indicates a downtrend.
Traders can adjust all settings from the inputs tab to customize sensitivity and signal frequency.
This indicator helps traders follow trends or identify reversals in short- and medium-term trading.
It’s easy to interpret, even for beginners, and can be combined with other technical indicators to refine trade entries.
By providing clear pivot-based signals, it reduces guesswork and simplifies trade decision-making.
Free Download
Download the “volatility-pivot.mq4” MT4 indicator
Key Features
- Identifies buy and sell signals using dynamic pivot points.
- Adjustable input settings to customize signals.
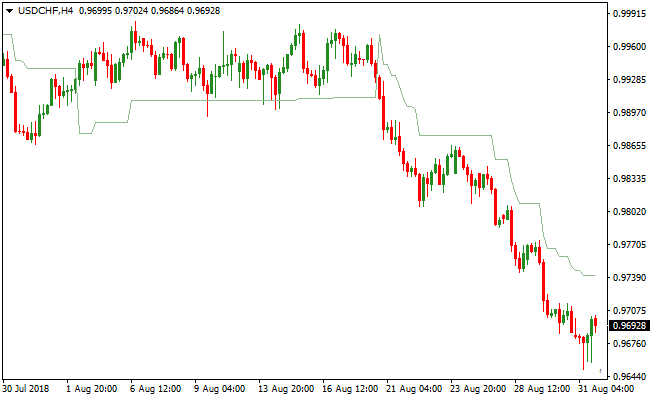
Indicator Chart
The Volatility Pivot Buy Sell indicator plots a dynamic green line that acts as a pivot reference.
Price crossing above this line signals bullish momentum, while crossing below signals bearish momentum.
The chart clearly shows when short-term or medium-term trend changes occur.
This allows traders to spot buy and sell opportunities quickly and efficiently.
Guide to Trade with Volatility Pivot Buy Sell Indicator
Buy Rules
- Open a buy trade when price crosses above the green pivot line from below.
- Confirm upward movement with price action or trend indicator.
- Focus on setups where the price consolidates near the pivot before breaking out.
- Use short-term chart swings to time entries for scalping opportunities.
Sell Rules
- Open a sell trade when price crosses below the green pivot line from above.
- Confirm downward movement with price action or trend indicator.
- Look for setups where price rallies near the pivot before reversing.
- Use medium-term price swings to identify optimal entry points.
Stop Loss
- Place a stop loss just below recent support for buy trades.
- Place a stop loss just above recent resistance for sell trades.
- Keep stops tighter for scalping and wider for swing trades.
Take Profit
- Exit buy trades when price approaches the next resistance pivot.
- Exit sell trades when price approaches the next support pivot.
- Consider partial profits at intermediate pivots for long-term trends.
- Let strong trends continue if confirmed by price movement beyond pivot levels.
Volatility Pivot Buy Sell and Trend Logic Indicator Forex Strategy
This MT4 day trading strategy combines the market structure signals from the Volatility Pivot Buy Sell MT4 Forex Indicator with trend confirmation from the Trend Logic MT4 Forex Indicator.
It is designed for M5, M15, and H1 charts, providing a clear framework for identifying intraday trends and high-probability trade entries.
By combining pivot levels with trend signals, traders can capture directional moves while minimizing countertrend risk.
The Volatility Pivot indicator identifies bullish conditions when price is above the pivot and bearish conditions when price is below the pivot.
The Trend Logic indicator adds confirmation, showing a green line for buy signals and a red line for sell signals.
Using both indicators together ensures that trades are entered with momentum and trend alignment.
Buy Entry Rules
- Price must be above the Volatility Pivot, indicating a bullish market structure.
- The Trend Logic line must be green, confirming a buy signal.
- Enter a buy trade at the close of the candle where both conditions align.
- Place the stop loss below the most recent swing low or the pivot support level.
- Keep the trade open while the price remains above the pivot and the Trend Logic line stays green.
- Close the trade immediately if the Trend Logic line turns red or price closes below the pivot.
Sell Entry Rules
- Price must be below the Volatility Pivot, indicating a bearish market structure.
- The Trend Logic line must be red, confirming a sell signal.
- Enter a sell trade at the close of the candle where both conditions align.
- Place the stop loss above the most recent swing high or the pivot resistance level.
- Keep the trade open while the price remains below the pivot and the Trend Logic line stays red.
- Close the trade immediately if the Trend Logic line turns green or price closes above the pivot.
Advantages
- Combines pivot-based market structure with trend confirmation for higher probability trades.
- Helps traders identify intraday trends on M5, M15, and H1 charts effectively.
- Easy-to-read signals allow quick decision-making during active trading sessions.
- Applicable to multiple currency pairs and gold, providing frequent day trading opportunities.
- Reduces countertrend risk by requiring dual confirmation from pivot and trend indicators.
Drawbacks
- Signals can be less reliable during sideways or choppy markets where price oscillates around the pivot.
- Frequent monitoring is needed on M5, M15, and H1 charts to ensure proper alignment of price and trend signals.
- Late signals can occur in fast-moving markets, causing missed optimal entry points.
Case Study 1
On EURUSD M15 during the London session, price stayed above the Volatility Pivot while the Trend Logic line turned green, indicating a buy opportunity.
The position was opened and later exited for a profit of 28 pips as the Trend Logic line signaled a potential reversal.
Case Study 2
On GBPJPY H1 during the New York session, price remained below the Volatility Pivot and the Trend Logic line turned red, signaling a sell.
The trade was initiated and successfully closed for 84 pips when price moved above the pivot, capturing the downward move efficiently.
Strategy Tips
- Only take trades when both the price position relative to the pivot and the Trend Logic line confirm the same direction to increase the success rate.
- Use M5 charts for faster intraday trades, M15 for moderate-duration trades, and H1 for longer day trading setups.
- Set stop losses just beyond the recent swing high or low or pivot level to control risk effectively.
- Exit trades immediately if either the Trend Logic line changes color or price crosses the pivot against your trade direction.
- Limit trading during low liquidity periods or major news releases to reduce the risk of false signals.
- Consider taking partial profits when the move is strong while allowing the rest to follow the trend for larger gains.
- Focus on trend-following and momentum rather than overtrading to maintain consistent performance.
Download Now
Download the “volatility-pivot.mq4” Metatrader 4 indicator
FAQ
How do I customize the signals?
All input settings can be modified directly from the indicator’s inputs tab to adjust sensitivity and signal timing.
Can it be used with other indicators?
Yes, it can be combined with trend indicators or oscillators to filter entries and improve trade accuracy.
Summary
The Volatility Pivot Buy Sell MT4 indicator delivers clear buy and sell signals based on price interaction with dynamic pivot points.
It helps traders identify trend direction and short- to medium-term trading opportunities.
With fully adjustable settings and compatibility with all timeframes and currency pairs, this tool is flexible for scalping, day trading, and swing trading.
It’s designed for traders who want a straightforward way to follow price momentum and pivot-based signals.


