
The Waddah Attar Weekly Fibonacci indicator for MT4 displays the weekly Fibonacci levels on the main trading chart.
It also displays the week’s high and low prices on the chart.
This indicator is most useful for swing traders who want to take advantage of the H1, H4, and daily charts.
Fibonacci levels can be used in multiple ways, for example, to identify trade entries in existing trends (around the 38.2% retracement level).
You can download the Waddah Attar Monthly Fibonacci indicator here (works similarly).
Key Points
- Shows the weekly Fibonacci levels
- Pure price action tool
- Works best on H1, H4 and D1 charts
- Good for swing trading
- Well worth adding to your indicator collection
This indicator can work together with any existing trading strategy or system as a simple trend bias technical tool.
Free Download
Download the “Waddah_Attar_Weekly_Fibo.mq4” MT4 indicator
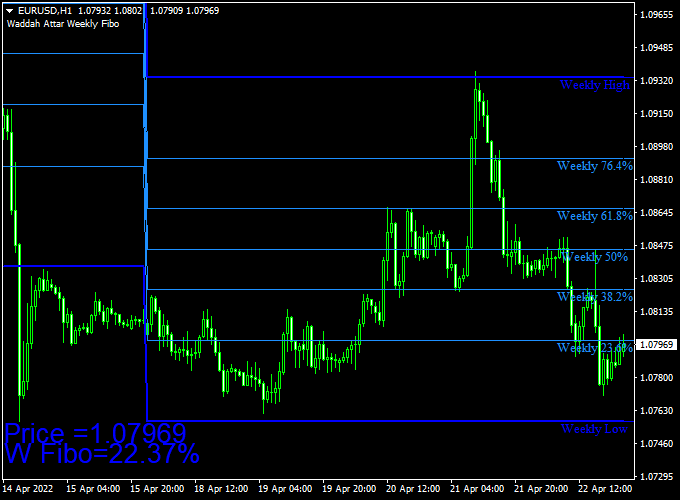
Indicator Example Chart
The EUR/USD 1-hour chart below shows the Waddah Attar Weekly Fibonacci Forex indicator in action.
Basic Trading Signals
Signals from the Waddah Attar Weekly Fibonacci indicator for Metatrader 4 are easy to interpret and go as follows:
BUY:
- In uptrending markets, open a buy trade near the 38.2% Fibonacci retracement level (buy on dips strategy). Confirm the trade entry with additional indicators.
- Place a stop loss just below the 50% retracement level.
- Deploy your take-profit strategy for buy trades.
SELL:
- In downtrending markets, open a sell trade near the 38.2% Fibonacci retracement level (sell on rallies strategy). Confirm the trade entry with additional indicators.
- Place a stop loss just above the 50% retracement level.
- Deploy your take-profit strategy for sell trades.
Download Now
Download the “Waddah_Attar_Weekly_Fibo.mq4” MT4 indicator
Weekly Fibonacci Reversal MT4 Strategy with Xmaster Confirmation
This strategy blends the strength of the Waddah Attar Weekly Fibonacci Indicator for MT4 with the signal precision of the Xmaster Formula Forex Indicator (2024 Version).
It helps Forex traders catch major reversals at weekly Fibonacci zones with trend confirmation, offering high probability entries and clean exits.
Strategy Overview
- Timeframe: H1 or H4
- Pairs: Major forex pairs (EUR/USD, GBP/USD, USD/JPY, etc.)
- Indicators Used:
Waddah Attar Weekly Fibonacci,
Xmaster Formula 2024
Buy Entry Rules
- Wait for the price to reach a key Fibonacci support level generated by the Waddah Attar Weekly Fibonacci Indicator.
- Look for a green bullish signal from the Xmaster Formula Indicator at or near the Fibonacci zone.
- Enter a buy trade on the close of the confirmation candle.
- Place your stop-loss just below the identified Fibonacci level or the recent swing low.
- Target the next Fibonacci resistance level or a 2:1 risk/reward ratio.
Sell Entry Rules
- Wait for price to approach a key Fibonacci resistance zone displayed by the Waddah Attar Weekly Fibonacci Indicator.
- Look for a red bearish signal from the Xmaster Formula Indicator at or near the resistance level.
- Enter a sell trade on the candle close after confirmation.
- Place your stop-loss just above the Fibonacci resistance level or the most recent swing high.
- Set a take-profit at the next support zone or aim for at least 2:1 risk-to-reward.
Strategy Trading Tips
- For best results, use higher timeframes (H4 or D1) to determine dominant weekly zones and lower timeframes (H1 or H4) for entries.
- Do not trade against the Xmaster trend — wait for clear signals that align with Fibonacci levels.
- Avoid entering trades during high-impact news events when the price may ignore technical zones.
Adjustable Parameters & Settings
Colors, show percent
Feel free to explore the indicator’s different parameters and settings to create your personalized indicator setup.
More Info About This Indicator
Currency Pairs: works on any currency pair
Trading Platform: developed for Metatrader 4 (MT4)
Time Frames: works on any time frame
Indicator Type: Fibonacci
Final Thoughts
The Waddah Attar Weekly Fibonacci Indicator for MetaTrader 4 is a valuable tool for swing traders aiming to identify key support and resistance levels based on weekly Fibonacci retracements.
Plotting seven Fibonacci levels derived from the previous week’s high and low provides clear visual cues for potential entry and exit points.
This indicator is particularly effective on higher timeframes such as H1, H4, and D1, aligning well with swing trading strategies.
For enhanced trade accuracy, consider combining it with other indicators like the Xmaster Formula or Bollinger Bands to confirm trend direction and momentum. .


