About the Weighted CCI Indicator
The Weighted CCI indicator is a momentum-based oscillator that builds on the traditional Commodity Channel Index by assigning more importance to recent price data.
This adjustment allows the indicator to react faster to current market conditions while reducing the influence of older price movements.
The indicator applies a weighting factor to each price bar, with the most recent data receiving the highest impact.
As a result, shifts in momentum are reflected more quickly compared to the standard CCI.
This makes the Weighted CCI especially useful for traders who want earlier signals during fast-moving markets.
The Weighted CCI oscillates around a zero level and highlights extreme conditions using predefined boundaries.
The +200 and -200 levels represent zones where price may be stretched too far in one direction, often preceding pullbacks or reversals.
This indicator works across all currency pairs and timeframes.
It is commonly used by traders who focus on momentum swings, intraday reversals, and short-term mean reversion setups.
Free Download
Download the “weighted-cci.ex4” MT4 indicator
Key Features
- Weighted calculation prioritizes recent price action.
- Faster response compared to the standard CCI.
- Clearly defined overbought and oversold zones.
- Displayed in a separate indicator window.
- Suitable for intraday and swing trading.
Indicator Chart
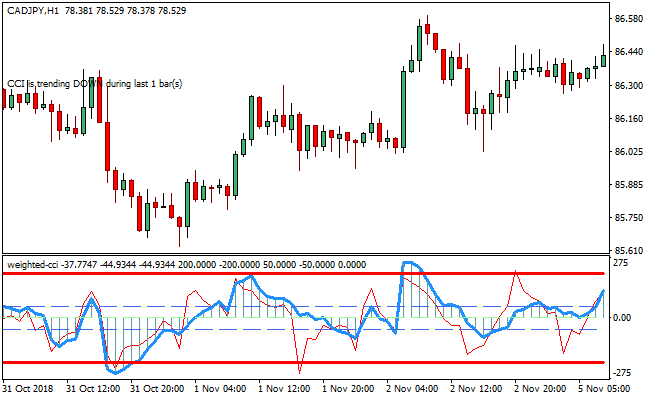
The Weighted CCI indicator is plotted in a separate window below the main price chart.
The chart shows a dodger blue oscillator line fluctuating around the zero level, with marked +200 and -200 boundaries.
These levels help traders identify momentum extremes and potential reaction zones.

Guide to Trade with the Weighted CCI Indicator
Buy Rules
- Wait for the Weighted CCI to move below the -200 level.
- Enter a buy trade when the line breaks back upward.
- Confirm that downside momentum is weakening.
- Prefer buy setups near established support zones.
Sell Rules
- Wait for the Weighted CCI to move above the +200 level.
- Enter a sell trade when the line turns down.
- Confirm that upside momentum is fading.
- Prefer sell setups near established resistance zones.
Stop Loss Rules
- Place the stop loss beyond the recent swing high or low.
- Increase the stop distance during volatile sessions.
- Exit early if momentum accelerates against the trade.
Take Profit Rules
- Target the zero level as an initial profit objective.
- Scale out near the opposite extreme zone.
- Hold remaining positions while momentum normalizes.
MT4 Weighted CCI + Wildan Trend System Scalping Strategy
This strategy combines the Weighted CCI MT4 Indicator with the Wildan Trend System MT4 Indicator.
The Weighted CCI oscillates with a dodger blue line: when this line breaks above –200 (oversold), it signals a potential long entry; when it breaks below +200 (overbought), it signals a potential short.
The Wildan Trend System displays a histogram: blue bars show a bullish trend, red bars show a bearish trend.
By combining the two, the strategy aims to pick scalping entries when both momentum extremes and trend direction align, increasing the odds of profitable, quick trades.
This method is most effective on short-term timeframes such as M1, M5, or M15, making it well-suited for scalpers.
It works especially well during active market sessions when the price is more likely to swing, and momentum extremes (captured by the CCI) are more meaningful.
Buy Entry Rules
- The dodger blue line of the Weighted CCI must break above –200, exiting the oversold zone.
- The Wildan Trend System histogram must be blue, indicating bullish trend strength.
- Enter a long position at the close of the candle that confirms the CCI break, and with the trend histogram still blue.
- Place the stop loss just below the most recent swing low on the chosen timeframe.
- Exit (take profit) when either:
- The Weighted CCI line reverses and crosses back below –200 (signaling loss of momentum), or
- The Wildan Trend System histogram flips from blue to red (trend weakening).
Sell Entry Rules
- The Weighted CCI dodger blue line must break below +200, exiting the overbought zone.
- The Wildan Trend System histogram must be red, confirming bearish trend strength.
- Enter a short position on the close of the candle in which the CCI breaks down and the histogram remains red.
- Place the stop loss just above the most recent swing high.
- Exit (take profit) when either:
- The Weighted CCI line reverses upward and crosses back above +200, or
- The Wildan Trend System histogram turns from red to blue (trend weakening).
Advantages
- Combines momentum extremes (Weighted CCI) with trend confirmation (Wildan histogram).
- Helps avoid entering weak or fading moves by requiring both indicators to align.
- Good for scalping: designed for short timeframes (M1, M5, M15).
- Exit rules allow dynamic exit based on changing momentum or trend.
- Relatively clear risk management: stop loss based on swing points, exit tied to indicator reversals.
Drawbacks
- In strongly trending markets, the Weighted CCI may stay beyond +200 or –200 for a while, making entries tricky.
- Scalping requires quick decision-making, especially when watching both momentum and trend indicators.
- The exit signals may come late in fast reversals, leading to giving back some profit.
- Frequent trades may lead to higher transaction cost impact (spread, slippage) if not managed well.
Example Case Study 1
On the EUR/JPY M5 chart during the London session, the Weighted CCI line dropped into deep oversold territory and then broke above –200.
At that same time, the Wildan histogram was blue, indicating bullish trend strength.
A long position was opened at the close of the confirming candle, with a stop loss placed just below the most recent M5 swing low (about 8 pips).
As the trade matured, the CCI began to drop again and eventually crossed back below –200, while the histogram remained blue.
That reversal of the CCI initiated the exit, locking in a solid scalp profit before any major pullback.
Example Case Study 2
On the GBP/USD M1 chart during the New York open, the CCI line spiked up into overbought territory and then broke down below +200.
Simultaneously, the Wildan histogram was red, confirming downward trend strength.
A short trade was taken at the candle close, with the stop loss placed above the recent swing high (12 pips).
The trade moved in favour quickly, and then the histogram flipped to blue, signaling trend weakening.
That flip was used to exit the trade, preserving most of the profit before a corrective bounce started.
Strategy Tips
- Avoid trades when the CCI just hovers near ±200 without a clean break; look for strong momentum shifts.
- Use small position sizes for scalping to protect against tight stop losses being hit.
- Consider combining price action (e.g. support/resistance) with these signals for higher-probability entries.
- Backtest the strategy on different pairs to find which ones produce the best signal alignment.
Download Now
Download the “weighted-cci.ex4” Metatrader 4 indicator
FAQ
How is the Weighted CCI different from the standard CCI?
The Weighted CCI gives more importance to recent price bars, allowing it to respond faster to changes in momentum.
Are the +200 and -200 levels fixed?
These levels are commonly used reference zones, but traders may adjust them depending on market behavior and timeframe.
Is the Weighted CCI suitable for trending markets?
It can be used in trends, but it performs best when identifying momentum exhaustion or pullbacks within broader moves.
Can this indicator be used alone?
It can generate standalone signals, but many traders prefer to confirm setups using price action or trend filters.
Summary
The Weighted CCI indicator offers a refined approach to momentum analysis by emphasizing recent price behavior.
This makes it more responsive during active market phases and better suited for timing entries.
With defined extreme levels and faster signal delivery, the indicator fits well into intraday and short-term trading strategies.
Traders looking for earlier momentum clues may find it a valuable upgrade over the traditional CCI.


