About the William Histogram With Signal Alert Indicator
The William Histogram With Signal Alert MT4 indicator is a technical analysis tool designed to identify bullish and bearish trends with ease.
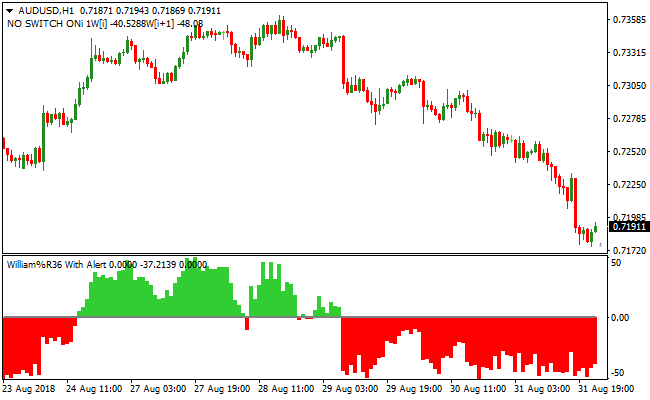
It plots a histogram in a separate window below the main activity chart, oscillating between +50 and -50 readings.
Green histogram bars indicate bullish momentum, while red histogram bars highlight bearish momentum.
The indicator is ideal for traders looking to enter the market in the direction of the prevailing trend.
While the histogram provides straightforward signals, pairing it with a trend-following indicator such as a moving average or Bollinger Bands can improve trade selection.
It works for any currency pair and time frame, making it suitable for scalping, day trading, and swing trading.
The default input settings are fixed, ensuring consistency in signal detection without needing adjustments.
Free Download
Download the “william-histogramm-with-alert.mq4” MT4 indicator
Key Features
- Green histogram bars signal bullish trends.
- Red histogram bars signal bearish trends.
- Displays trends in a separate MT4 window below price action.
- Simple, easy-to-read buy and sell signals.
- Can be used alongside trend-following indicators for better results.
Indicator Chart
The William Histogram With Signal Alert indicator visually highlights trend direction with colored bars.
Traders can instantly identify when the market is moving up or down.
Green bars suggest buy opportunities, and red bars indicate sell opportunities.
This allows traders to quickly focus on high-probability trend trades.

Guide to Trade with William Histogram With Signal Alert
Buy Rules
- Enter a buy trade when the histogram turns green above the zero line.
- Confirm that price is following a bullish trend on the main chart.
- Monitor for strong momentum before entry.
- Ignore signals during range-bound or flat market periods.
Sell Rules
- Enter a sell trade when the histogram turns red below the zero line.
- Confirm that price is following a bearish trend on the main chart.
- Wait for sufficient downward momentum before entering.
- Ignore signals when the market is consolidating sideways.
Stop Loss
- Use recent swing highs or lows as reference for stops.
- Adjust stops according to volatility or personal strategy.
- Keep the stop fixed until the histogram shows a reversal.
- Close the trade if price action invalidates the trend.
Take Profit
- Target prior key levels or recent support/resistance zones.
- Consider partial profits at intermediary trend barriers.
- Exit trades when the histogram changes color against the trade.
- Let strong momentum runs continue if the trend remains intact.
William Histogram with Signal Alert and Multi Trend Bars Forex Strategy
This MT4 forex strategy combines the momentum signals of the William Histogram with Signal Alert MT4 Forex Indicator with trend strength confirmation from the Multi Trend Bars MT4 Forex Indicator.
It is designed for M5, M15, and H1 charts and is suitable for traders looking to catch strong intraday and swing trends.
By combining momentum and trend strength, this strategy aims to improve trade accuracy and capture higher probability setups.
The William Histogram indicator generates green bars above 0 as buy signals and red bars below 0 as sell signals.
The Multi Trend Bars indicator confirms trend strength, showing all green bars for a strong bullish trend and all red bars for a strong bearish trend.
Taking trades only when both indicators align ensures entries with higher probability and reduces countertrend risks.
Buy Entry Rules
- The Multi Trend Bars indicator must show all green bars, confirming a strong bullish trend.
- The William Histogram shows green bars above 0, signaling a buy.
- Enter a buy trade at the close of the candle where both indicators align.
- Place the stop loss below the most recent swing low or minor support level.
- Keep the trade open while the Multi Trend Bars remain all green and the histogram stays above 0.
- Close the trade immediately if the Multi Trend Bars turn all red or the histogram drops below 0.
Sell Entry Rules
- The Multi Trend Bars indicator must show all red bars, confirming a strong bearish trend.
- The William Histogram shows red bars below 0, signaling a sell.
- Enter a sell trade at the close of the candle where both indicators align.
- Place the stop loss above the most recent swing high or minor resistance level.
- Keep the trade open while the Multi Trend Bars remain all red and the histogram stays below 0.
- Close the trade immediately if the Multi Trend Bars turn all green or the histogram rises above 0.
Advantages
- Combines trend strength and momentum signals to improve trade accuracy.
- Easy-to-read visual signals help traders spot high-probability setups quickly.
- Reduces the risk of trading against the trend by filtering entries through both indicators.
- Can be applied to various currency pairs and gold, offering frequent trading opportunities.
- Suitable for both short-term scalping and longer intraday moves.
Drawbacks
- Less effective during sideways markets when trends are weak or inconsistent.
- Requires active monitoring to ensure both indicators remain aligned.
- Signals may lag slightly in fast-moving markets, causing missed entries.
Case Study 1
On EURUSD M15 during the London session, the Multi Trend Bars showed all green bars, indicating a strong bullish trend.
The William Histogram also displayed green bars above 0, signaling a buy.
A trade was entered and closed for 31 pips when the histogram dropped below 0, successfully capturing a strong intraday upward move.
Case Study 2
On GBPJPY H1 during the New York session, the Multi Trend Bars showed all red bars, confirming a strong bearish trend.
The William Histogram displayed red bars below 0, signaling a sell trade.
The trade was maintained while both indicators aligned and closed for 67 pips when the Multi Trend Bars turned all green, effectively capturing a short-term downtrend.
Strategy Tips
- Only take trades when the William Histogram and Multi Trend Bars both confirm the same direction to increase trade accuracy.
- Use M5 charts for quick scalps, M15 for intraday trades, and H1 for longer-term moves.
- Focus on major currency pairs and gold where trends are stronger and signals are more reliable.
- Set stop losses near recent swing highs or lows to minimize risk from sudden price spikes.
- Close trades immediately if either indicator reverses to protect profits and limit losses.
- Consider taking partial profits when the price moves significantly in your favor while keeping the remainder open to ride the trend.
- Be patient and wait for clear alignment between momentum and trend indicators before entering a trade.
Download Now
Download the “william-histogramm-with-alert.mq4” Metatrader 4 indicator
FAQ
Does it provide entry and exit alerts?
The indicator provides visual histogram signals but does not include automated alerts.
Traders need to monitor the bars for buy and sell opportunities.
Is it suitable for volatile markets?
Yes, the histogram reflects market momentum effectively even during high volatility.
It can help traders spot rapid trend changes in any currency pair.
How does it complement other indicators?
It works well alongside moving averages, Bollinger Bands, or trend-following indicators.
This combination helps confirm trend direction and improves trade timing.
Summary
The William Histogram With Signal Alert MT4 indicator highlights market momentum with clear green and red bars.
It simplifies spotting bullish and bearish trends for traders across different time frames.
This versatile tool can be used alone or with other technical indicators to improve decision-making.
It helps traders quickly identify momentum shifts and find potential trade opportunities.


