
About the YangTrader Forex Indicator
The YangTrader indicator for MetaTrader 4 is an efficient momentum oscillator built to pinpoint specific exhaustion points in the market.
It works by tracking price velocity and translating that data into a single blue line that oscillates within a fixed range.
By monitoring how this line interacts with the 15 and 80 levels, you can identify when a currency pair has moved too far in one direction and is likely to snap back or reverse.
Unlike standard oscillators that often feel sluggish, YangTrader is optimized for responsiveness.
It filters out minor price noise to focus on significant shifts in market pressure.
When the blue line enters the extreme upper or lower zones, it alerts you to potential trend fatigue.
This allows you to prepare for high-probability setups before the rest of the market reacts to the change in direction.
Free Download
Download the “YangTrader.mq4” indicator for MT4
Key Features
- The indicator utilizes two primary horizontal levels at 15 and 80 to define market extremes.
- It features a dedicated blue oscillator line that tracks price momentum in real time.
- The lightweight code ensures the tool operates smoothly without lagging your MT4 platform.
- It provides a clear distinction between overextended bullish moves and exhausted bearish runs.
- The tool adapts well to various timeframes, from intraday scalping to long-term swing trading.
- It functions effectively as a standalone filter or as a confirmation tool for price action strategies.
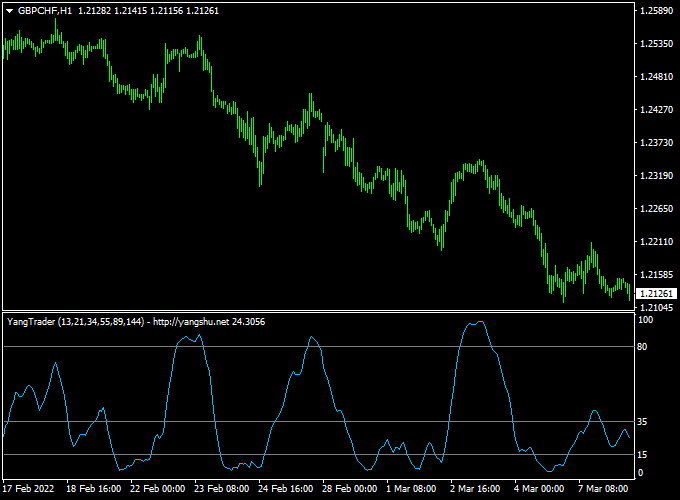
Indicator Chart (GBP/CHF H1)
The chart displays the YangTrader indicator for MT4 plotted in a separate window below the price action.
You can see the blue line navigating between the 15 and 80 boundaries to provide buy and sell signals.
When the line recovers from the bottom zone, it indicates a bullish turn, while a drop from the top zone suggests the bears are taking control.
Guide to Trade with YangTrader
Buy Rules
- Wait for the blue oscillator line to drop below the 15 level into the oversold zone.
- Identify a shift where the blue line crosses back above the 15 level.
- Ensure the overall market context or higher timeframe trend is pointing upward.
- Enter a long position at the close of the candle that coincides with the upward cross.
Sell Rules
- Monitor the blue oscillator line until it rises above the 80 level into the overbought zone.
- Look for the blue line to turn downward and cross back below the 80 level.
- Confirm that the primary market trend is currently bearish or showing signs of resistance.
- Open a short position once the oscillator confirms the break back into the central range.
Stop Loss
- For buy trades, place your stop loss a few pips below the most recent swing low.
- For sell trades, set the stop loss slightly above the recent local swing high.
Take Profit
- Exit long trades when the blue line reaches the opposite 80 overbought level.
- Close short positions when the indicator line touches the 15 oversold boundary.
- You may also use a fixed reward-to-risk ratio of at least 2:1 for consistent results.
YangTrader + XP Moving Average MT4 Forex Day Trading Strategy
This day trading strategy combines the YangTrader Forex Indicator for MT4 with the XP Moving Average Indicator for MT4.
It is designed for active intraday trading on M5 and M15 charts, allowing traders to capture short-term moves with a clear trend and momentum confirmation.
The YangTrader indicator signals overbought and oversold conditions through a blue line, while the XP Moving Average confirms the prevailing trend with green and red histogram bars.
How This Strategy Works
The YangTrader indicator identifies potential reversals: a cross above the 15 level signals bullish recovery from oversold conditions, while a cross below 80 signals a bearish reaction from overbought conditions.
The XP Moving Average acts as a trend filter: green histogram bars indicate an uptrend, while red bars indicate a downtrend.
Trades are taken only when both indicators align, filtering out low-probability setups and increasing the chances of capturing consistent intraday gains.
Buy Entry Rules
- Wait for the YangTrader blue line to cross back above the 15 oversold level.
- Confirm that the XP Moving Average histogram is green, indicating an upward trend.
- Enter a buy trade at the close of the confirmation candle.
- Place a stop loss below the most recent swing low, typically 8–15 pips for M5 charts and 15–25 pips for M15 charts.
- Take profit at 1.5–2 times the stop loss distance or when the XP Moving Average turns red.
Sell Entry Rules
- Wait for the YangTrader blue line to cross below the 80 overbought level.
- Confirm that the XP Moving Average histogram is red, indicating a downtrend.
- Enter a sell trade at the close of the confirmation candle.
- Place a stop loss above the most recent swing high, typically 8–15 pips for M5 and 15–25 pips for M15.
- Take profit at 1.5–2 times the stop loss distance or when the XP Moving Average turns green.
Advantages
- Combines momentum and trend confirmation for higher-probability trades.
- Visual indicators make it easy to identify entries and exits on M5 and M15 charts.
- Works well on multiple pairs with moderate volatility, such as EUR/USD, GBP/USD, and AUD/JPY.
- Short holding times reduce exposure to overnight risk.
Drawbacks
- Requires active monitoring due to fast-moving M5 and M15 charts.
- Stop loss and take profit levels may need adjustment depending on pair volatility.
- May miss larger trend moves when waiting for the oversold/overbought confirmation.
Case Study 1 – EUR/USD M5 Chart
On EUR/USD during the London session, the YangTrader blue line crossed above 15 around 1.1005 while the XP Moving Average histogram turned green.
A buy trade was entered at 1.1008 with a stop loss at 1.0995.
Price moved up to 1.1028, capturing +20 pips within 30 minutes.
The trade was closed as the XP Moving Average began turning neutral.
Case Study 2 – AUD/JPY M15 Chart
On AUD/JPY, the YangTrader blue line crossed below 80 at 94.75 while the XP Moving Average histogram was red.
A sell trade was taken at 94.73 with a stop loss at 94.90.
The pair declined to 94.40 within 45 minutes, gaining +33 pips.
The trade was exited when the histogram showed early signs of trend weakening.
Strategy Tips
- Focus on high-liquidity pairs during active trading sessions for faster executions.
- Adjust stop loss levels slightly wider for highly volatile pairs like GBP/JPY.
- Keep trades short and disciplined to match the scalping/day trading style.
Download Now
Download the “YangTrader.mq4” indicator for Metatrader 4
FAQ
How does the YangTrader blue line differ from a standard RSI?
The YangTrader blue line uses a unique calculation that places its extreme levels at 15 and 80 rather than the traditional 30 and 70.
This creates a tighter window for signals, which can help in avoiding premature entries during strong trends.
Can I change the 15 and 80 level settings in the inputs?
Yes, you can modify these levels in the indicator settings if you want to make the tool more or less sensitive.
Increasing the upper level or decreasing the lower level will result in fewer but more selective trading signals.
Summary
The YangTrader indicator for MetaTrader 4 is a reliable technical tool that focuses on identifying price extremes.
Using the 15 and 80 levels helps you stay on the right side of market momentum.
While it works well on its own, combining it with horizontal support and resistance levels can further improve your win rate.


