The ZUP indicator for MT4 scans the price chart for Fibonacci, Gartley, Butterfly, Drive, AB=CD, and other price action patterns that might help you to find great trade entries and exits.
The indicator appears in the main chart window and draws all price action patterns directly in the price chart.
It’s an advanced trading tool that should be working well for seasoned traders.
Key Features
- Finds price action patterns
- Good for advanced traders
- No lagging indicator
- Well worth adding to your indicator collection
This indicator can work together with any existing trading strategy or system.
Free Download
Download the “Zup.mq4” MT4 indicator
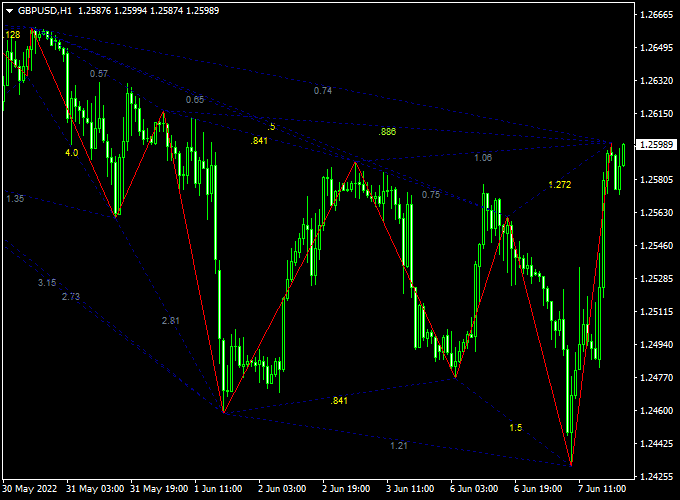
Indicator Example Chart
The GBP/USD 1-hour chart below shows the ZUP Forex indicator in action.

Buy/sell Trading Signals
BUY:
- Open a buy trade when a bullish price action pattern appears on the chart.
- Place a stop loss below the price action pattern.
- Exit the buy trade for a predetermined profit target.
SELL:
- Open a sell trade when a bearish price action pattern appears on the chart.
- Place a stop loss above the price action pattern.
- Exit the sell trade for a predetermined profit target.
Download Now
Download the “Zup.mq4” MT4 indicator
Enhanced Trading Strategy: Combining ZUP Forex Indicator with RSI for Momentum Confirmation
Overview
To improve the reliability of trade signals, this strategy integrates the ZUP Forex Indicator with the Relative Strength Index (RSI) indicator.
While the ZUP Indicator identifies various harmonic patterns such as Gartley, Butterfly, Bat, and AB=CD, the RSI provides insights into market momentum, helping to confirm potential trade entries and filter out false signals.
Required Indicators
- ZUP Forex Indicator: Scans the price chart for harmonic patterns and draws them directly on the chart, indicating potential reversal zones.
- Relative Strength Index (RSI): A momentum oscillator that measures the speed and change of price movements, helping to identify overbought or oversold conditions.
Trading Rules
Buy Setup
- Wait for the ZUP Indicator to display a completed bullish harmonic pattern (e.g., Bullish Gartley, Bullish Butterfly) on the chart.
- Confirm that the RSI is below 30, indicating an oversold condition and potential upward momentum.
- If both conditions are met, enter a long position.
- Place a stop loss below the pattern’s completion point or the recent swing low.
- Set a take profit target based on the pattern’s projected move or a risk-to-reward ratio of at least 1:2.
Sell Setup
- Wait for the ZUP Indicator to display a completed bearish harmonic pattern (e.g., Bearish Gartley, Bearish Butterfly) on the chart.
- Confirm that the RSI is above 70, indicating an overbought condition and potential downward momentum.
- If both conditions are met, enter a short position.
- Place a stop loss above the pattern’s completion point or the recent swing high.
- Set a take profit target based on the pattern’s projected move or a risk-to-reward ratio of at least 1:2.
Tips for Implementation
- Apply this strategy to time frames of 1 hour or higher to reduce market noise.
- Use additional tools like support and resistance levels to identify optimal entry and exit points.
- Always test the strategy on a demo account before applying it to live trading.
Strategy Conclusion
By combining the ZUP Forex Indicator’s harmonic pattern recognition with the RSI’s momentum analysis, traders can enhance the accuracy of their entries and exits.
This integrated approach aims to provide more reliable trading opportunities by confirming potential reversals with momentum indicators.
Technical Parameters & Settings
Bars, delta, Fibonacci, hidden, size, colors, style
More Info About This Indicator
Currency Pairs: works on any currency pair
Trading Platform: developed for Metatrader 4 (MT4)
Time Frames: any
Indicator Type: price action
Final Thoughts
The ZUP Forex Indicator for MT4 is a powerful tool designed for advanced traders seeking to identify key price action patterns such as Fibonacci, Gartley, Butterfly, Drive, and AB=CD directly on their charts.
By scanning the price chart, it highlights potential reversal zones, aiding in precise trade entries and exits.
This non-lagging indicator enhances traditional technical analysis by providing visual cues for pattern recognition.
While it offers valuable insights, it’s recommended to combine the ZUP Indicator with other tools, like the RSI, to confirm trade signals and manage risk effectively.
Its versatility across various timeframes and currency pairs makes it adaptable to different trading strategies.
Overall, the ZUP Forex Indicator is a valuable addition to any trader’s toolkit, offering enhanced pattern recognition capabilities.


