
The RSI Candles With Keltner channel indicator for Metatrader 5 combines RSI + Keltner channel and it delivers buy and sell trade entries.
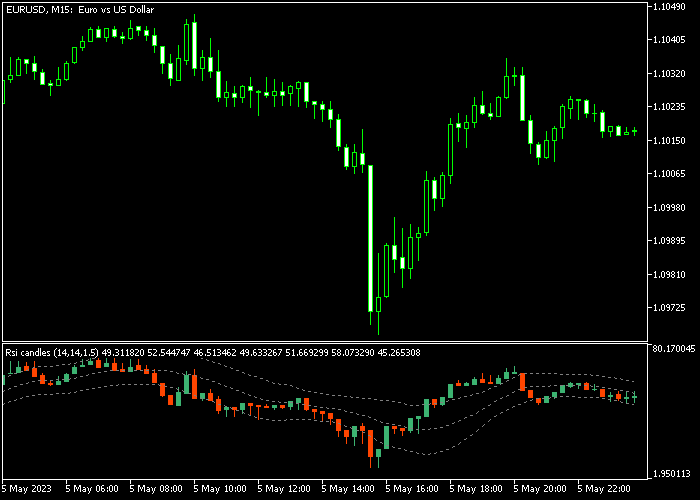
The indicator gets displayed in a separate chart as a gray-colored Keltner channel + RSI candles.
How to interpret this technical tool?
- A buy trend occurs when the RSI candles cross above the upper Keltner channel band.
- A sell trend occurs when the RSI candles cross below the lower Keltner channel band.
The following indicator inputs and parameters can be modified: RSI period (14), channel period, and channel multiplier (1.5).
Tip: For 1-minute and 5-minute chart traders, the indicator delivers the best results in the London and New York trading sessions.
Make yourself familiar with this technical indicator and test it first on a demo account for an extended period.
Download Indicator 🆓
Rsi candles with Keltner channel.mq5 Indicator (MT5)
Chart Example
The following chart shows how the RSI Candles With Keltner channel Forex indicator looks when applied to the MT5 chart.
How To Buy And Sell Forex Pairs With The RSI Candles With Keltner channel Indicator?
Find a simple trading example below:
Buy Signal
- A buy signal is given when the RSI candle crosses the upper Keltner channel band bottom-up.
- Open a buy trade and place your stop loss a few pips below technical support.
- Close the buy trade for a fixed profit target or exit the trade at key resistance levels.
Sell Signal
- A sell signal is given when the RSI candle crosses the lower Keltner channel band top-down.
- Open a sell trade and place your stop loss a few pips above technical resistance.
- Exit the sell trade for a fixed profit target or exit the trade at key support levels.
Download Now 🆓
Rsi candles with Keltner channel.mq5 Indicator (MT5)
Frequently Asked Questions
How Do I Install This Custom Indicator On Metatrader 5?
- Open the MT5 trading platform
- Click on the File menu button located at the top left part of the platform
- Click on Open Data Folder > MQL5 folder > Indicators
- Copy the Rsi candles with Keltner channel.mq5 indicator file in the Indicators folder
- Close and restart the trading platform
- You will find the indicator here (Navigator window > Indicators)
- Drag the indicator to the chart to get started with it!
How Do I Edit This Indicator?
- Click in the open chart with your right mouse button
- In the dropdown menu, click on Indicator List
- Select the indicator and click on properties
- Now you can edit the inputs, colors, levels, scale and visualization
- Finally click the OK button to save the new configuration


