
About the Guppy Zones Indicator Indicator
The Guppy Zones indicator for MT5 is a trend-following tool designed to help traders identify high-probability buy and sell opportunities.
It uses a combination of short-term and long-term moving averages to determine the direction of the trend and highlight potential entry points.
The short-term averages react quickly to price movements, while the long-term averages confirm the overall trend.
This makes it easier to trade with the market momentum rather than against it.
Traders can use the indicator on any currency pair or trading instrument, and it is particularly effective in markets with strong, sustained trends.
It provides actionable signals without overwhelming the chart with excessive information, allowing traders to make timely decisions.
Free Download
Guppy Zones.ex5 Indicator (MT5)
Key Features
- Displays buy and sell trends clearly using short-term and long-term moving averages.
- Adjustable parameters for short-term and long-term periods to suit different trading styles.
- Helps identify trend reversals and continuation points quickly.
- Works across all major currency pairs and instruments.
- Includes configurable smoothing methods to reduce noise in volatile markets.
Indicator Chart
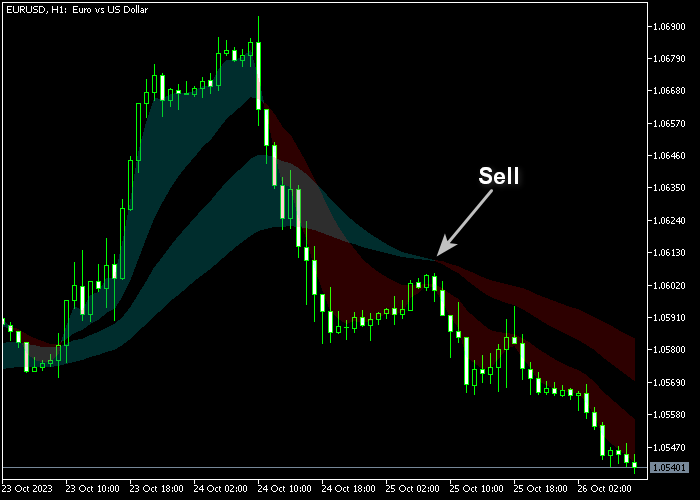
The Guppy Zones indicator appears beneath the main price area.
The chart shows clear buy and sell trends based on the relationship between short-term and long-term moving averages.
When the short-term averages cross above the long-term averages, it signals a buy trend.
When they cross below, it signals a sell trend.
This setup helps traders spot momentum shifts and trade in the direction of the prevailing trend.
Guide to Trade with Guppy Zones
Buy Rules
- Short-term moving averages are positioned above long-term moving averages.
- The market is in an uptrend with higher highs and higher lows.
- Confirm momentum with rising price action or supporting technical indicators.
- Enter a buy trade when the short-term averages start to fan out above the long-term averages.
Sell Rules
- Short-term moving averages are positioned below long-term moving averages.
- The market is in a downtrend with lower highs and lower lows.
- Confirm momentum with falling price action or supporting technical indicators.
- Enter a sell trade when the short-term averages start to fan out below the long-term averages.
Stop Loss
- Place the stop loss below the nearest swing low for buys.
- Place the stop loss above the nearest swing high for sells.
- Use a trailing stop if the trend is strong and extends over multiple bars.
Take Profit
- Close the trade when short-term averages cross back below long-term averages for buys.
- Close the trade when short-term averages cross back above long-term averages for sells.
- Alternatively, target nearby support and resistance levels to secure profits.
- Consider scaling out partially at key levels to lock in gains.
Guppy Zones and Trend Hunter MT5 Strategy
This strategy combines the Guppy Zones Forex Indicator for MT5 and the Trend Hunter Forex Indicator for MT5 to capture strong trending moves.
It works by identifying both short-term momentum and long-term trend direction.
This combination helps traders enter trades in the direction of the trend while avoiding false signals.
The strategy performs best on 15-minute, 30-minute, and 1-hour time frames and is ideal for traders who prefer clear rules and manageable trade setups.
Buy Entry Rules
- Open a buy trade when the short-term moving averages on the Guppy Zones are positioned above the long-term moving averages.
- Confirm the buy signal when a blue Trend Hunter arrow appears on the chart.
- Place the stop loss below the nearest support level or below the long-term Guppy moving averages for protection.
- Close the trade when the short-term moving averages cross below the long-term moving averages or when a magenta Trend Hunter arrow appears.
- As an alternative take profit, target the next significant resistance level on the chart.
Sell Entry Rules
- Open a sell trade when the short-term moving averages on the Guppy Zones are positioned below the long-term moving averages.
- Confirm the sell signal when a magenta Trend Hunter arrow appears on the chart.
- Place the stop loss above the nearest resistance level or above the long-term Guppy moving averages for protection.
- Close the trade when the short-term moving averages cross above the long-term moving averages or when a blue Trend Hunter arrow appears.
- As an alternative take profit, target the next significant support level on the chart.
Case Study 1
On the EUR/USD 30-minute chart, the short-term moving averages of the Guppy Zones are positioned above the long-term averages, signaling a bullish trend.
Shortly after, a blue Trend Hunter arrow appeared confirming the buy entry.
The trade was entered with a stop loss just below the long-term Guppy moving averages.
The price continued higher and reached the next resistance level, providing a clean take profit.
The trade was closed when the short-term averages crossed below the long-term averages, securing profits.
Case Study 2
On the GBP/JPY 1-hour chart, the short-term moving averages on the Guppy Zones are positioned below the long-term averages, indicating a bearish trend.
A magenta Trend Hunter arrow appeared shortly after, confirming the sell entry.
The stop loss was placed above the long-term moving averages to limit risk.
The price continued downward, hitting the next support level.
The trade was closed when the short-term averages crossed above the long-term averages, capturing the trend with minimal risk.
Download Now
Guppy Zones.ex5 Indicator (MT5)
FAQ
What timeframe works best for Guppy Zones?
The indicator performs strongly on higher timeframes like H1 and H4 but can be adapted for shorter timeframes with adjusted parameters.
Can I use Guppy Zones with other indicators?
Yes, it pairs well with momentum oscillators or volume-based indicators to confirm trade signals and reduce false entries.
How do I customize the moving averages?
You can adjust the short-term start and end periods, long-term period, and smoothing method to fit your trading style and market conditions.
Is it suitable for all market conditions?
It works best in trending markets. Sideways or choppy conditions may produce false signals, so extra confirmation is recommended.
Summary
The Guppy Zones indicator helps traders follow market trends with confidence.
Its combination of short-term and long-term moving averages provides actionable buy and sell signals without cluttering the chart.
Adjustable parameters make it adaptable for various instruments and timeframes.
By focusing on trend alignment and momentum, traders can enter positions with higher probability setups.
Testing on a demo account is recommended to understand its behavior in different market scenarios.
Overall, it is a practical tool for traders looking to improve timing and accuracy in trend-based strategies.


