
The TRIX Candles Forex Signal indicator for Metatrader 5 transforms the regular TRIX indicator into buy & sell candles.
The indicator provides reliable trading signals and never repaints.
It can be used as a standalone buy/sell technical tool or combined with any other technical indicator of your preference.
How to trade with it?
- A green colored signal line marks a bullish trend.
- A red colored signal line represents a bearish trend.
The following indicator inputs and parameters can be modified: TRIX period, style, color.
Tip for scalpers and intraday traders: the TRIX Candles indicator tends to deliver the best results in the London and New York trading sessions.
Make yourself familiar with this technical indicator and test it first on a demo account for an extended period.
Download Indicator 🆓
TRIX candles.mq5 Indicator (MT5)
Chart Example
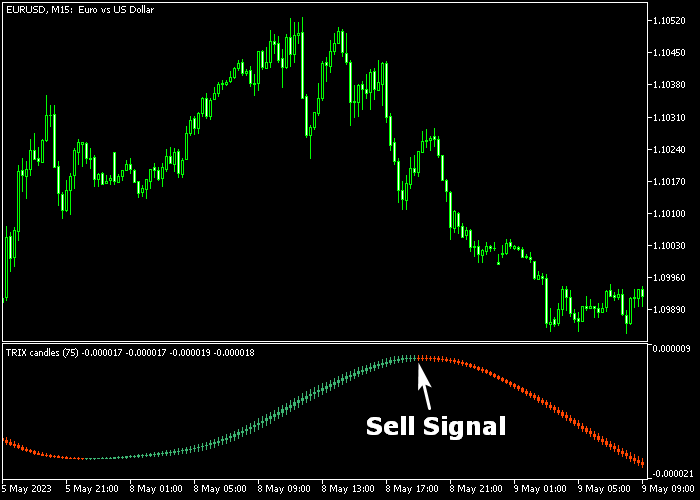
The following chart shows what the TRIX Candles Forex Signal indicator looks like when applied to the MT5 chart.
How To Buy And Sell Currency Pairs With The TRIX Candles Forex Signal Indicator?
Find a simple trading example below:
Buy Signal
- The start of the green colored line represents a buy trade signal.
- Initiate a long trade and set a stop loss below short-term support.
- Reverse the buy position when a valid sell signal appears on the chart.
Sell Signal
- The start of the red colored line represents a sell trade signal.
- Initiate a short trade and set a stop loss above short-term resistance.
- Reverse the sell position when a valid buy signal appears on the chart.
Download Now 🆓
TRIX candles.mq5 Indicator (MT5)
Frequently Asked Questions
How Do I Install This Custom Indicator On Metatrader 5?
- Open the MT5 trading platform
- Click on the File menu button located at the top left part of the platform
- Click on Open Data Folder > MQL5 folder > Indicators
- Copy the TRIX candles.mq5 indicator file in the Indicators folder
- Close and restart the trading platform
- You will find the indicator here (Navigator window > Indicators)
- Drag the indicator to the chart to get started with it!
How Do I Edit This Indicator?
- Click in the open chart with your right mouse button
- In the dropdown menu, click on Indicator List
- Select the indicator and click on properties
- Now you can edit the inputs, colors, levels, scale and visualization
- Finally click the OK button to save the new configuration


