About the Stochastic Crossing Signals Indicator
The Stochastic Crossing Signals Indicator for MT4 is a robust technical tool that combines the momentum tracking of a stochastic oscillator with the smoothing properties of a moving average.
It plots actionable arrows directly on your price candles, allowing for faster decision-making and better market timing.
The indicator is designed to highlight “overextended” price points where a change in direction is likely.
Its ability to work across all timeframes makes it a versatile utility for anyone from scalpers to swing traders looking for a systematic way to enter the market.
Free Download
Download the “stoch-crossing.mq4” MT4 indicator
Key Features
- Combines stochastic momentum and moving average smoothing for high-accuracy triggers.
- Displays green up arrows for bullish signals and red down arrows for bearish signals.
- Places alerts directly on the activity chart to keep your focus on price action.
- Features fully adjustable inputs for both the stochastic and moving average components.
- Helps traders maintain discipline by offering objective, non-discretionary entry points.
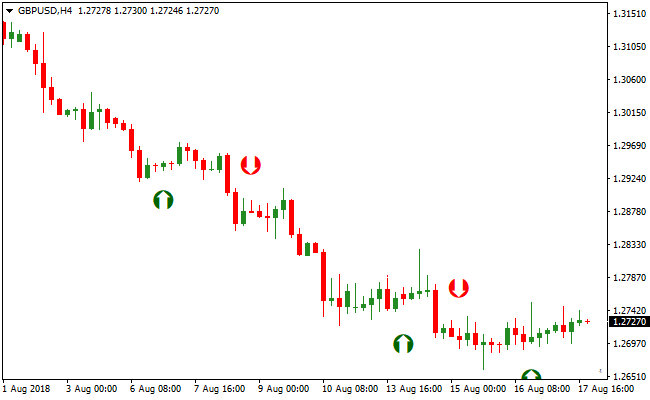
Indicator Chart
The Stochastic Crossing Signals Indicator appears as colored arrows on the main price chart.
A green arrow pointing upward indicates that the bullish momentum has crossed a specific threshold, signaling a buy.
A red arrow pointing downward suggests that bearish pressure is taking over, signaling a sell.

Guide to Trade with Stochastic Crossing Signals Indicator
Buy Rules
- Determine the overall market trend is bullish using a long-term moving average.
- Monitor the chart for the appearance of a green up arrow.
- Ensure the candle associated with the arrow has closed decisively.
- Initiate a long position at the start of the next candle.
Sell Rules
- Verify that the broader market trend is bearish through technical analysis.
- Watch for a red down arrow to be painted on the activity chart.
- Confirm that the bearish momentum is sustained on the candle close.
- Execute a short trade immediately to capture the downward expansion.
Stop Loss
- For buy trades, place the stop loss a few pips below the most recent swing low.
- For sell trades, position the stop loss slightly above the nearest swing high.
- Maintain a stop distance that accounts for current volatility to avoid premature exits.
Take Profit
- Set a target at the next major horizontal resistance or support zone.
- Alternatively, exit the position when an opposing arrow signal appears on the chart.
Stochastic Crossing Signals Forex Day Trading Strategy for MT4
This MT4 day trading strategy combines entry timing from the Stochastic Crossing Signals Metatrader 4 Forex Indicator with trend direction confirmed by the No Repaint Forex Signals Indicator MT4.
This strategy is built for the lower timeframes such as M1, M5, and M15.
It is designed to help day traders enter high probability trades by combining a reliable trend filter with precise entry arrows.
The Stochastic Crossing Signals indicator paints green arrows for buy signals and red arrows for sell signals directly on the price chart.
The No Repaint Forex Signals indicator complements this by showing trend direction through colored dots: blue dots indicate a buy trend and magenta dots indicate a sell trend.
By taking trades only when both indicators align, you reduce the number of false entries and increase the likelihood of capturing quick intraday moves.
Buy Entry Rules
- The No Repaint Forex Signals indicator must display a blue dot, indicating a bullish trend.
- Wait for a green arrow from the Stochastic Crossing Signals indicator to appear on the price chart.
- Enter a buy trade at the close of the candle where the green arrow appears in alignment with the blue dot trend.
- Place the stop loss below the recent swing low or a nearby support level.
- Set the take profit at the next visible resistance zone, or exit when either the blue dot changes to magenta or a red arrow appears.
Sell Entry Rules
- The No Repaint Forex Signals indicator must display a magenta dot, indicating a bearish trend.
- Wait for a red arrow from the Stochastic Crossing Signals indicator to appear on the price chart.
- Enter a sell trade at the close of the candle where the red arrow appears in alignment with the magenta dot trend.
- Place the stop loss above the recent swing high or a nearby resistance level.
- Set the take profit at the next visible support zone, or exit when either the magenta dot changes to blue or a green arrow appears.
Advantages
- Combining trend confirmation with entry arrows helps filter out weak trades.
- The strategy works on lower timeframes, allowing frequent intraday opportunities.
- Signals are straightforward to interpret, which suits both new and experienced traders.
- Helps traders stay aligned with the prevailing trend, reducing countertrend entries.
- Flexible across M1, M5, and M15 charts for different day trading styles.
Drawbacks
- Requires active monitoring of charts due to fast signals on lower timeframes.
- Late trend dot changes can sometimes cause delayed exits or missed profit opportunities.
Case Study 1
On EURCHF M5 during the London session, the No Repaint Forex Signals indicator showed a blue dot, confirming a bullish trend.
Shortly after, a green arrow appeared from the Stochastic Crossing Signals indicator.
A buy trade was entered and closed for 7 pips when price approached the next resistance and the No Repaint dot turned magenta, capturing a quick intraday move.
Case Study 2
On USDJPY M15 during the New York session, a magenta dot appeared from the No Repaint Forex Signals indicator, signaling a bearish trend.
A red arrow followed from the Stochastic Crossing Signals indicator.
A sell trade was placed and later closed for 23 pips when price reached a support area and the trend dot changed to blue, effectively capturing the downward intraday move.
Strategy Tips
- Always trade in the direction of the trend dot to avoid weak countertrend trades.
- Focus on sessions with high liquidity, such as London and New York, for more reliable signals.
- Avoid taking trades just before major news events to reduce the chance of whipsaws.
- Consider scaling out partial profits near key support or resistance levels.
- Use the M1 chart for quick snaps, the M5 for balanced setups, and the M15 for larger intraday moves.
- Be selective and wait for both indicators to align before entering trades.
- Keep a trade journal to refine your understanding of how different pairs respond to this strategy.
Download Now
Download the “stoch-crossing.mq4” Metatrader 4 indicator
FAQ
How do the adjustable settings affect the arrows?
The settings in the input tab allow you to change the sensitivity of the signals. Lower values will generate more frequent arrows, which can be useful for scalping.
Higher values will smooth out the data, providing fewer but more significant signals for day trading and swing trading.
Why should I ignore signals that go against the main trend?
Trading in the direction of the dominant trend significantly increases your win rate.
If the overall trend is up, the red arrows often represent minor pullbacks rather than full reversals.
By only taking buy arrows in an uptrend, you ensure you are trading with the path of least resistance.
Summary
The Stochastic Crossing Signals Indicator is a powerful utility for traders who want to simplify their technical analysis without losing accuracy.
Its primary benefit is the clarity it brings to the chart, removing the need for manual oscillator interpretation and reducing emotional decision-making.
To achieve the best results, always integrate these signals into a broader trading plan that includes trend confirmation and sound risk management.
Using the arrows as a final entry trigger within a disciplined strategy is a proven way to improve your market timing.


