
About the Trend Reversal Indicator
The Trend Reversal indicator for MT4 identifies potential trend reversals using an exponential moving average (EMA) crossover system.
It plots a series of colored dots in a separate indicator window, signaling shifts between bullish and bearish momentum.
Blue dots above red dots signal a bullish trend, suggesting that buyers are gaining control.
Red dots above blue dots indicate a bearish trend, signaling seller dominance.
The color-coded system is intuitive and easy to interpret, making it accessible even to traders new to forex.
The default EMA periods can be customized via the Inputs tab, allowing traders to fine-tune the indicator for different currency pairs and timeframes.
It is particularly effective for short-term strategies such as scalping and day trading, helping traders spot early trend reversals before they fully develop.
Free Download
Download the “trend-reversal.ex4” MT4 indicator
Key Features
- Detects trend reversals using an EMA crossover system.
- Displays colored dots in a separate window for easy trend identification.
- Blue dots signal bullish momentum; red dots signal bearish momentum.
- Customizable EMA periods for different trading styles and pairs.
Indicator Chart
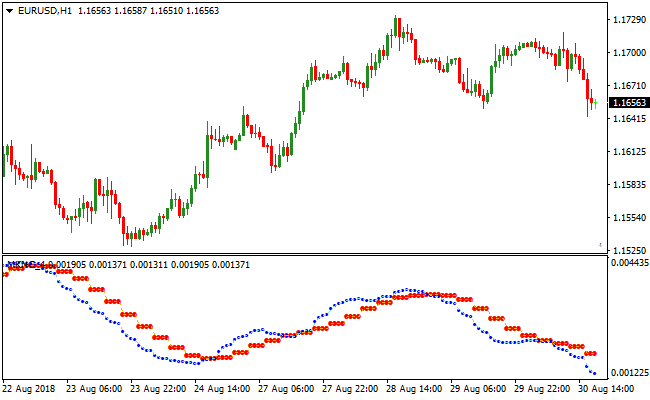
The Trend Reversal indicator chart shows blue and red dots in a separate window beneath the price chart.
The image illustrates how blue dots crossing above red dots provide a buy signal, while red dots crossing above blue dots generate a sell signal.
Traders can follow these crossovers to align trades with emerging trends and identify potential reversals early.
Guide to Trade with the Trend Reversal Indicator
Buy Rules
- Wait for blue dots to cross above red dots from below in the indicator window.
- Confirm bullish momentum with recent price action or another trend-following tool.
- Enter a long trade at the close of the confirmation candle.
- Avoid entering during sideways movement or high-impact news events.
Sell Rules
- Wait for red dots to cross above blue dots from below in the indicator window.
- Confirm bearish momentum with recent price action or an additional trend tool.
- Enter a short trade at the close of the confirming candle.
- Avoid selling near strong support or during consolidating markets.
Stop Loss
- Set the stop loss a few pips below the entry candle for buy trades to limit risk.
- Set the stop loss a few pips above the entry candle for sell trades to protect the position.
- Use trailing stops to lock in profits as the trade moves in your favor.
- Adjust the stop loss based on recent volatility or key swing points.
Take Profit
- Close part of the trade once price reaches the next significant support or resistance level.
- Exit the full trade if the dots reverse direction in the indicator window.
- Allow trades to run longer in strong trends but monitor for early reversal signals.
Trend Reversal Indicator and Supply Demand Zones Forex Strategy
This MT4 forex strategy combines momentum reversal detection from the Trend Reversal indicator with key market structure analysis from the Supply Demand Zones indicator.
The strategy focuses on entering trades when the market shows early signs of trend continuation near significant support or resistance zones.
The Trend Reversal indicator displays blue and red dots to highlight potential shifts in market direction.
When blue dots appear above red dots, it signals bullish momentum. Conversely, red dots above blue dots indicate bearish momentum.
The Supply Demand Zones indicator plots major areas of support and resistance as colored blocks, helping traders identify optimal entry and exit points.
This strategy works best on M15, M30, and H1 timeframes.
Buy Entry Rules
- The Trend Reversal indicator must show blue dots painted above red dots, confirming bullish momentum.
- The price should be near a blue supply-demand zone acting as strong support.
- Enter the buy trade at the close of the candle when the Trend Reversal confirms the bullish signal.
- Stop loss is placed below the blue support zone or the most recent swing low.
- Take profit is set at the next red resistance zone or when the Trend Reversal signals a potential reversal.
Sell Entry Rules
- The Trend Reversal indicator must show red dots painted above blue dots, confirming bearish momentum.
- The price should be near a red supply-demand zone acting as strong resistance.
- Enter the sell trade at the close of the candle when the Trend Reversal confirms the bearish signal.
- Stop loss is placed above the red resistance zone or the most recent swing high.
- Take profit is set at the next blue support zone or when the Trend Reversal indicates a potential trend change.
Advantages
- Combines momentum-based entries with key support and resistance levels for higher probability trades.
- Visual dots and zones simplify decision-making and reduce emotional trading.
- Helps traders capture trend reversals at strategic levels rather than chasing price.
- Supports both trend continuation and pullback strategies.
Drawbacks
- Effectiveness can decrease in choppy or sideways markets.
- False breakouts near zones may trigger early stop-outs.
- Limited trade frequency compared to scalping strategies.
Case Study 1
On EURUSD M15 during the London session, the Trend Reversal indicator displayed blue dots above red dots near a strong blue support zone plotted by the Supply Demand Zones indicator.
A buy trade was entered at candle close, with the stop loss below the support zone.
Price moved upward and reached the next red resistance zone, resulting in a gain of 31 pips.
Case Study 2
On GBPJPY M30 during the New York session, the Trend Reversal indicator showed red dots above blue dots near a prominent red resistance zone.
A sell trade was entered at confirmation, with the stop loss above the resistance zone.
Price declined steadily and hit the next blue support zone, capturing 65 pips.
Strategy Tips
- Always wait for Trend Reversal dots to align with supply-demand zones before entering trades.
- Focus on higher timeframes to reduce false signals caused by minor price fluctuations.
- Use the colored zones to dynamically adjust stop loss and take profit levels.
- Confirm entries on candle close to reduce early signal errors.
- Maintain disciplined risk management to protect capital in volatile markets.
Download Now
Download the “trend-reversal.ex4” Metatrader 4 indicator
FAQ
Which timeframes are most effective?
Short-term traders typically use M1, M5, or M15 charts for scalping and day trading.
The indicator also works on H1 for slightly longer intraday setups.
How should EMA periods be adjusted?
Lower EMA periods increase sensitivity for faster signals, suitable for scalping.
Higher EMA periods smooth out fluctuations for more conservative intraday trades.
Summary
The Trend Reversal indicator provides a simple yet effective way to detect emerging trend changes.
Its colored dot system highlights bullish and bearish momentum, making it easy to identify reversals before they fully develop.
Adjustable EMA periods allow traders to tailor the indicator for scalping, day trading, or short-term swing strategies.
Combining it with price action or additional confirmation tools enhances trade reliability.
This tool helps traders capture early trend shifts, manage risk effectively, and improve the timing of entries and exits.


