
About the Colored Trading Bands Signals Indicator
The Colored Trading Bands Signals indicator for MT4 is based on a dynamic trading channel that highlights market direction and potential trade entries.
It combines price bands with visual arrow signals to help traders identify opportunities quickly.
The indicator plots three bands directly on the chart.
The upper resistance band is colored magenta, the lower support band is colored blue, and the mid line is colored orange.
These levels help define trend direction and potential reaction zones.
Green and red arrows appear on the chart to signal buy and sell opportunities.
When price trades above the mid line, market bias remains positive.
When price trades below the mid line, the market bias turns negative.
All settings can be adjusted from the inputs tab, allowing traders to experiment with sensitivity and channel behavior based on different market conditions.
Free Download
Download the “colored-bands-signals.mq4” MT4 indicator
Key Features
- Channel-based trading bands with clear visual levels.
- Magenta resistance and blue support bands.
- Orange mid line used for trend direction.
- Green and red arrows for trade signals.
- Fully adjustable input parameters.
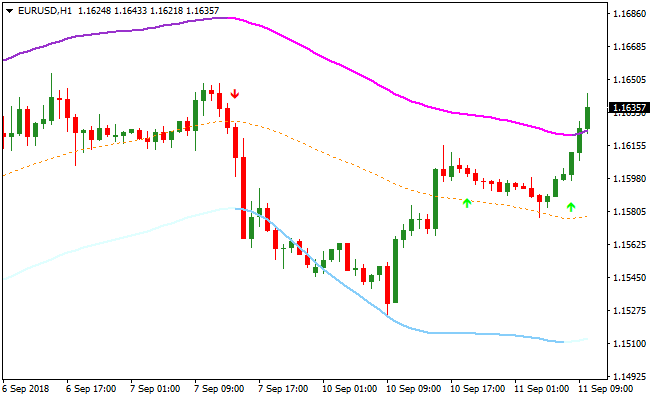
Indicator Chart
The image below displays the Colored Trading Bands Signals indicator applied to an active price chart.
The trading channel highlights trend direction, while green and red arrows mark potential buy and sell entries when price aligns with the mid line bias.
Guide to Trade with Colored Trading Bands Signals Indicator
Buy Rules
- Apply the indicator to your preferred timeframe.
- Confirm price is trading above the orange mid line.
- Wait for a green arrow to appear on the chart.
- Open a buy trade at the close of the signal candle.
Sell Rules
- Ensure the indicator channel is clearly visible.
- Confirm price is trading below the orange mid line.
- Wait for a red arrow to appear on the chart.
- Open a sell trade at the close of the signal candle.
Stop Loss
- Place the stop loss just below the mid line for buy trades.
- Place the stop loss just above the mid line for sell trades.
- Widen the stop slightly on higher timeframes.
Take Profit
- Close buy trades near the upper resistance band.
- Close sell trades near the lower support band.
- Take partial profits if price stalls near the bands.
- Exit early if price crosses back through the mid line.
MT4 Strategy: Colored Trading Bands + XP Moving Average Scalping Method
This MT4 scalping strategy combines the Colored Trading Bands Signals Indicator and the XP Moving Average Indicator to create a clear and fast decision-making method for intraday trading.
It is ideal for M1, M5, and M15 charts where traders need quick, simple, and repeatable entry rules.
The Colored Trading Bands highlight short-term direction by showing how price behaves around the midline.
A green arrow appearing while price trades above this line often signals a healthy bullish move, while a red arrow forming under the mid line points toward a bearish continuation.
The XP Moving Average strengthens those signals by turning green in rising markets and red in falling ones, helping traders avoid counter trend entries.
This strategy suits traders who want structure without complexity.
The chart remains easy to read, the signals are direct, and the approach works well across many currency pairs during active sessions.
Beginners will appreciate the clarity, while experienced scalpers will enjoy the steady flow of opportunities on lower time frames.
Buy Entry Rules
- Price moves above the mid line of the Colored Trading Bands.
- A green arrow appears from the indicator.
- The XP Moving Average line is green and rising.
- Place a stop loss below the nearest swing low.
- Take profit at the next band resistance or when price reaches a previous intraday high.
Sell Entry Rules
- Price moves below the mid line of the Colored Trading Bands.
- A red arrow appears on the chart.
- The XP Moving Average line is red and declining.
- Place a stop loss above the nearest swing high.
- Take profit at the next band support or a previous intraday low.
Advantages
- Easy trade entries thanks to the clear arrows and band structure.
- XP Moving Average filters out trades against the trend.
- Works well on many fast moving currency pairs.
- Suitable for traders who enjoy quick trades and fast sessions.
- Low learning curve for beginners.
Drawbacks
- Lower time frames can produce false signals during very quiet periods.
- Best results require discipline and avoiding over trading.
Case Study 1: AUDUSD M5
On AUDUSD M5, the XP Moving Average turned green shortly after the Asian session opened.
Price moved above the mid line of the Colored Trading Bands and a green arrow appeared at the same moment.
A buy position was taken with a stop under the recent swing low.
The pair continued upward through the next band and reached an intraday high.
The trade captured about 17 pips, which is a solid result for this time frame.
The combination of a rising XP Moving Average and the green arrow gave a clean confirmation for entry.
Case Study 2: EURGBP M15
During the London session, EURGBP formed a red arrow while price was trading under the mid line of the Colored Trading Bands.
The XP Moving Average was already red and pointed downward.
A sell entry was taken with a stop above the nearest high.
Price continued to decline and touched the next band boundary.
The move produced around 24 pips.
Strategy Tips
- Trade during the London and New York sessions for cleaner movement and reduced noise.
- Look for arrows near band edges rather than the center. This helps ensure price has enough space for the move.
- Avoid trading directly into major support or resistance zones visible on recent highs and lows.
- Stay away from signals formed seconds before major economic news. Lower time frames react sharply to these events.
- If the XP Moving Average is flat, skip the setup. Flat lines indicate uncertainty and choppy movement.
Download Now
Download the “colored-bands-signals.mq4” Metatrader 4 indicator
FAQ
How does the mid line affect trade direction?
The mid line acts as a trend filter. Trades taken above it favor buys, while trades below it favor sells.
Do the arrows repaint?
Arrows are generated based on price interaction with the bands and are best evaluated after candle close.
Can the band colors or sensitivity be changed?
Yes, traders can modify settings in the inputs tab to adjust channel width and signal behavior.
Summary
The Colored Trading Bands Signals indicator offers a simple way to trade with trend direction using a channel-based approach.
By combining trend bias from the mid line with clear entry arrows and logical exit levels, the indicator supports disciplined and repeatable trading decisions across different market conditions.


