
About the TRIX Oscillator Indicator
The TRIX Oscillator Indicator is a versatile momentum tool built for the Metatrader 4 platform that excels at smoothing out price action and eliminating market noise.
The name is derived from “Triple Exponentially Smoothed Moving Average,” which highlights its core function of calculating the rate of change of a triple-smoothed exponential moving average.
This advanced smoothing process allows the indicator to stay focused on significant trend movements while ignoring the minor, erratic price spikes that often trigger false signals.
The primary benefit of the TRIX Oscillator Indicator is its dual-layered signal generation.
It identifies the broader trend based on its position relative to the zero line and provides specific entry triggers through a two-line crossover system.
When the TRIX is above the zero level, the momentum is bullish, whereas values below the zero level indicate a bearish environment.
Free Download
Download the “dl-trix.mq4” MT4 indicator
Key Features
- The indicator utilizes triple-smoothed moving averages to minimize market lag.
- It features a dual-line crossover system consisting of a fast and a slow signal line.
- The zero-line threshold serves as a definitive filter for bullish and bearish trends.
- The blue and red signal lines provide immediate visual feedback on momentum shifts.
- The default 12 and 9 settings are optimized for standard intraday market cycles.
- It works efficiently on all timeframes, from the M1 scalping charts to the Daily view.
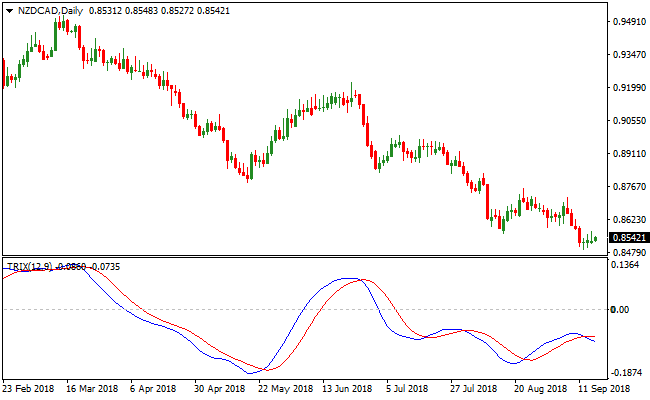
Indicator Chart
The chart displays the TRIX Oscillator Indicator in the bottom window, showing the interaction between the blue fast line and the red slow line.
You can see how these lines oscillate around the 0.00 zero level.
When the blue line is positioned above the red line and both are in the positive zone, it confirms a strong uptrend.
Conversely, when the blue line stays below the red line in the negative zone, the chart highlights a dominant bearish phase.
Guide to Trade with the TRIX Oscillator Indicator
Buy Rules
- Ensure the TRIX Oscillator Indicator is positioned above the 0.00 zero level.
- Wait for the blue signal line to cross above the red signal line from below.
- Open a buy trade position once the crossover is confirmed on the current candle close.
- Focus on signals that occur as price bounces off a known support level on the main chart.
Sell Rules
- Confirm the TRIX Oscillator Indicator is fluctuating below the 0.00 zero level.
- Wait for the blue signal line to cross below the red signal line from above.
- Initiate a short trade position at the opening of the next candle following the crossover.
- Prioritize sell signals that align with descending peaks in the price action.
Stop Loss
- Place the stop loss a few pips below the most recent swing low for buy positions.
- Position the stop loss a few pips above the most recent swing high for sell positions.
- Adjust the stop distance based on the volatility of the specific currency pair being traded.
Take Profit
- Close the trade when the blue and red signal lines produce an opposite crossover.
- Exit a buy trade if the blue line crosses back below the red line.
- Exit a sell trade if the blue line crosses back above the red line.
- Apply a trailing stop to lock in profits as the trend continues in your favor.
TRIX Oscillator Indicator + 4 Moving Average System MT4 Trend Strategy
This strategy combines the TRIX Oscillator for MT4 and the 4 Moving Average System Trend Indicator for MT4.
The TRIX Oscillator gives momentum confirmation: when both its blue and red lines sit above the zero level, it signals bullish momentum; when both are below zero, it signals bearish momentum.
The 4 Moving Average System confirms trend direction: a bullish trend occurs when the price candle crosses and closes above all four moving averages; a bearish trend occurs when the candle crosses and closes below all four moving averages.
Using both indicators together makes it possible to catch trend-based moves with stronger confirmation, reducing noise and increasing trade reliability.
This strategy works well on H1 and H4 charts for swing/day trading, but can also be adapted to H15 or M30 for shorter trades.
It is most effective on major currency pairs with good liquidity and during active market sessions.
By requiring both momentum and trend confirmation, the strategy aims to enter trades only when there is both structural and dynamic support behind the move.
Buy Entry Rules
- TRIX Oscillator blue and red lines are both above the zero level, confirming bullish momentum.
- The price candle closes above all four moving averages of the 4 Moving Average System.
- Enter a buy trade at the close of that confirming candle.
- Place a stop-loss a few pips below the nearest swing low or below the lowest of the four moving averages.
- Take profit at the next major resistance level or after a reasonable pip gain (e.g. 50–100 pips on H1 / H4), depending on pair volatility.
Sell Entry Rules
- TRIX Oscillator blue and red lines are both below the zero level, confirming bearish momentum.
- The price candle closes below all four moving averages of the 4 Moving Average System.
- Enter a sell trade at the close of that confirming candle.
- Place a stop-loss a few pips above the nearest swing high or above the highest of the four moving averages.
- Take profit at the next major support level or after a reasonable pip drop (e.g. 50–100 pips on H1 / H4), depending on pair volatility.
Advantages
- Combines momentum and trend confirmation, improving the quality of entries.
- Reduces the risk of being caught in counter‑trend moves or false breakouts.
- Works on multiple timeframes depending on trader preference (H1/H4 for bigger moves; H15/M30 for quicker entries).
- Clear, rule‑based entries and exits make the strategy easier to follow and less emotional.
- Suitable for major currency pairs with stable trend behavior and good liquidity.
Drawbacks
- Fewer trade signals because both indicators need to align before an opportunity appears.
- Trend reversal or sudden volatility can break price through moving‑average support quickly, hitting stop-losses.
- Potential drawdown during sideways markets where moving averages flatten and momentum oscillates around zero.
- Not ideal for traders seeking frequent small scalps; better for swing/day trades.
Example Case Study 1
On GBPUSD H1 during a London session strong trending day, the TRIX Oscillator blue and red lines were both above zero.
Price broke above all four moving averages and closed the candle there at 1.2820.
A buy trade was entered at 1.2822 with a stop-loss placed around 1.2755 (below the recent swing low).
Price continued rising over the next 10 hours and hit resistance near 1.2950.
The trade was closed for roughly 128 pips profit before any sign of reversal.
Example Case Study 2
On AUDJPY H4 during a clear downtrend, the TRIX Oscillator lines moved below zero.
The price closed a candle below all four moving averages at 92.45, confirming the bearish trend.
A sell trade was entered at 92.44 with a stop-loss at 93.10 (above recent swing high).
Over the next two days, the pair moved down to 90.80, resulting in about 165 pips profit before signs of consolidation appeared.
Strategy Tips
- Prefer major, high‑liquidity pairs to reduce spread and slippage impact, especially on H1/H4 charts.
- Wait for clean confirmation: both TRIX lines clear zero and the candle closes beyond all moving averages before entering.
- Consider higher‑timeframe filters (e.g. check H4 trend before H1 entry) to align with broader market direction and avoid counter‑trend entries.
- Manage risk by adjusting stop-loss size based on pair volatility and recent structure.
- Be patient with target zones and allow sufficient time for trend expansion, especially on H4 setups.
- Keep a trading journal to track which pairs and timeframes produce the best results and refine entry/exit rules over time.
Download Now
Download the “dl-trix.mq4” Metatrader 4 indicator
FAQ
What is the significance of the zero level in the TRIX Oscillator Indicator?
The zero level acts as the balance point for market momentum.
When the indicator stays above zero, it means the triple-smoothed average is increasing, which signifies a bullish trend.
When it drops below zero, the average is decreasing, signaling a bearish trend.
Trading crossovers in alignment with the zero line significantly improves the quality of your entries.
Can I adjust the period settings for different timeframes?
Yes, the TRIX Oscillator Indicator is fully customizable.
The default settings of 12 and 9 are great for intraday trading.
However, if you are trading on the H4 or Daily charts, you might want to increase the period to 20 or 30 to catch larger swings and ignore small corrections that occur during the week.
Summary
The TRIX Oscillator Indicator is a robust technical tool that offers a sophisticated way to navigate market trends.
Its triple-smoothing logic provides a significant benefit by offering a much cleaner signal than standard oscillators.
By combining the zero-line filter with the signal line crossovers, traders can effectively identify high-probability entries while staying on the right side of the dominant trend.


