
About the Dynamic Zone RSI Indicator
The Dynamic Zone RSI Indicator is an advanced technical tool for the Metatrader 4 platform that evolves the classic Relative Strength Index by adding floating volatility bands.
Standard RSI indicators use fixed overbought and oversold levels, which often lead to premature signals in trending markets.
This version solves that problem by surrounding the RSI line with two adaptive bands that serve as dynamic support and resistance zones.
The purple band represents the upper resistance boundary, while the orange band functions as the lower support boundary.
These zones fluctuate in real-time based on the recent price range and market intensity.
The primary advantage of the Dynamic Zone RSI Indicator is its ability to identify extreme price deviations within the context of current volatility.
By monitoring when the RSI line moves outside these floating zones, traders can spot high-probability mean reversion opportunities.
Free Download
Download the “dynamic-zone-rsi.mq4” MT4 indicator
Key Features
- The indicator combines a 5-period RSI with adaptive 30-period volatility bands.
- It features a purple resistance band and an orange support band for signal generation.
- The floating zones adjust automatically to account for shifts in market volatility.
- It delivers specific buy and sell triggers based on band penetrations and recoveries.
- The tool resides in a separate window to keep the main price chart uncluttered.
- All input parameters are fully customizable to suit different trading timeframes.
Indicator Chart
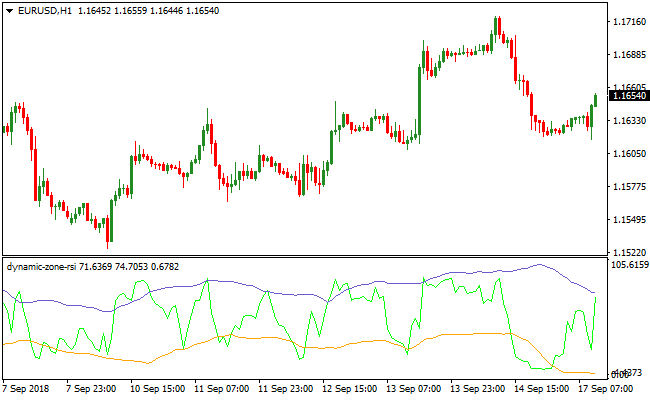
The chart displays the Dynamic Zone RSI Indicator in a dedicated sub-window below the price candles.
You can see the RSI line oscillating between the purple and orange bands as the market moves.
When the line dips below the orange zone and hooks back up, it suggests a bullish recovery.
When it pushes above the purple zone and drops back down, it signals a bearish reversal.
Guide to Trade with Dynamic Zone RSI Indicator
Buy Rules
- Identify a market that is either ranging or in an established uptrend.
- Wait for the RSI line to fall completely below the orange support band.
- Enter a buy trade when the RSI line crosses back above the orange band from below.
- Ensure the move is supported by bullish price action on the main chart.
Sell Rules
- Identify a market that is either ranging or in an established downtrend.
- Wait for the RSI line to rise completely above the purple resistance band.
- Initiate a short trade when the RSI line crosses back below the purple band from above.
- Confirm the signal aligns with the broader bearish sentiment of the session.
Stop Loss
- Place your stop loss a few pips below the most recent local swing low for buy orders.
- Position the stop loss a few pips above the most recent local swing high for sell orders.
- This ensures the trade is protected against sudden volatility spikes against your position.
Take Profit
- Close the trade when the RSI line reaches the opposite dynamic band.
- Exit a buy trade when the RSI touches the purple resistance band.
- Exit a sell trade when the RSI touches the orange support band.
- You may also exit when an opposite crossover signal is generated by the indicator.
Dynamic Zone RSI + Fibonacci Pivot Lines MT4 Scalping Strategy
This scalping strategy combines the Dynamic Zone RSI Indicator for MT4 with the Fibonacci Pivot Lines MT4 Indicator.
The Dynamic Zone RSI gives timely overbought/oversold band-cross signals and reversals.
The Fibonacci Pivot Lines indicator gives a simple market bias: trades above the pivot are bullish, trades below the pivot are bearish.
This combination allows scalpers to enter on momentum reversals while respecting the shorter-term market bias given by pivot levels.
This method works best on the M5 chart (though it can be used on M1 for tighter scalps), and is ideal for major or liquid currency pairs during active trading sessions.
Because entries depend on both RSI reversal and pivot‑line filter, the system aims to produce higher‑probability scalps with tight stop losses and quick exits.
Buy Entry Rules
- Dynamic Zone RSI crosses below the lower (orange) support band, then returns and closes back above that band, signaling a bullish reversal.
- Price at the same time is above the current Fibonacci pivot level, confirming bullish bias.
- Enter a buy order on the candle close that returns above the support band.
- Place a stop loss a few pips below the recent swing low or the low of the signal candle.
- Take profit at a fixed small target, typically 5 to 15 pips, or exit early if RSI approaches the upper resistance band without reaching the target.
Sell Entry Rules</
- Dynamic Zone RSI crosses above the upper (purple) resistance band, then returns and closes back below that band, signaling a bearish reversal.
- Price at the same time is below the current Fibonacci pivot level, confirming bearish bias.
- Enter a sell order on the candle close that returns below the resistance band.
- Place a stop loss a few pips above the recent swing high or the high of the signal candle.
- Take profit at a fixed small target, typically 5 to 15 pips, or exit if RSI approaches the lower support band without reaching the target.
Advantages
- Combines momentum‑based reversal signals with pivot‑level bias to reduce false entries.
- Works well on lower timeframes for fast scalping and multiple trades per session.
- Fixed small profit targets and tight stop losses limit exposure to sudden spikes.
- Filters trades in the direction of short-term bias provided by pivot lines.
Drawbacks
- Scalping small pip targets requires frequent trading to accumulate meaningful gains.
- In choppy or low‑volatility markets, the RSI may oscillate without strong moves, leading to many small losing or breakeven trades.
- Requires quick execution and constant monitoring, especially on M5 or M1 charts.
- Spreads and slippage can reduce net profits when targets are small.
Example Case Study 1
On AUDUSD M5 during the London session, price was above the current Fibonacci pivot.
The Dynamic Zone RSI dropped below the orange support band, then reversed and closed back above it at 0.7024.
A buy order was entered at 0.7025 with a stop loss at 0.7019.
Within 7 minutes price climbed to 0.7038.
The trade was closed for +13 pips before any reversal signal from RSI appeared.
Example Case Study 2
On USDCHF M5 during the New York session, price was below the daily Fibonacci pivot, indicating a bearish bias.
The Dynamic Zone RSI crossed above the purple resistance band, then came back down and closed below at 0.9142.
A sell order was entered at 0.9141 with a stop loss at 0.9148.
Price moved down to 0.9129 within 10 minutes.
The trade was closed for +12 pips before RSI approached the lower band.
Strategy Tips
- Use major or high‑liquidity currency pairs to minimize spread and slippage impact.
- Ensure RSI clearly crosses and returns through the bands before entering the trade.
- Keep stop loss tight but allow a few pips buffer to avoid being triggered by minor noise.
- Stick to small profit targets to avoid overexposure; aim for consistency rather than large individual gains.
- Track trades in a log to evaluate which pairs and sessions yield the best results for this scalping method.
Download Now
Download the “dynamic-zone-rsi.mq4” Metatrader 4 indicator
FAQ
How does the Dynamic Zone RSI Indicator handle trending markets?
Unlike a traditional RSI that stays overbought or oversold for long periods, the Dynamic Zone RSI Indicator adapts.
Because the bands move with the price, they require the RSI to reach a true extreme relative to the trend before a signal occurs.
This helps traders stay in trends longer while avoiding the trap of selling too early in a strong bull move.
What are the best settings for the RSI and the bands?
The default settings use a period of 5 for the RSI and 30 for the bands.
This configuration is excellent for capturing short-term swings and intraday movements.
If you prefer a slower approach for swing trading, you can increase the RSI period to 14 to smooth out the signals and focus on major price turns.
Should I use a trend filter with this indicator?
Yes, it is highly recommended to use a trend-following tool like a 200-period Moving Average alongside the Dynamic Zone RSI Indicator.
By only taking buy signals when the price is above the average and sell signals when it is below, you significantly increase the reliability of each trade by staying on the right side of the market.
Summary
The Dynamic Zone RSI Indicator offers a significant upgrade over traditional momentum oscillators by incorporating the element of volatility.
Its ability to create unique, floating boundaries for price action ensures that traders are always looking at momentum within a relevant context.
The benefit of this approach is a reduction in false signals and a more responsive entry system for various market conditions.


