
About the Magic Vision Dashboard Indicator
The Magic Vision Dashboard indicator for MT4 is built around three moving averages set at different speeds.
A fast moving average uses a period of 5, a medium moving average uses a period of 15, and a slow moving average is set to 60.
Together, they evaluate short-, medium-, and longer-term price behavior.
Instead of plotting signals directly on the chart, the indicator displays its analysis inside a dashboard.
This allows Forex traders to monitor several currency pairs and timeframes at the same time.
A green dashboard signals bullish conditions, while a red dashboard points to bearish momentum.
This makes it easier to spot trend alignment without switching charts.
The indicator works from the 1-minute timeframe and higher, making it useful for both short-term traders and those managing longer trades.
Free Download
Download the “magic-vision.mq4” MT4 indicator
Key Features
- Uses three moving averages to evaluate trend direction.
- Fast MA set to period 5.
- Medium MA set to period 15.
- Slow MA set to period 60.
- Dashboard view for multiple pairs and timeframes.
- Color-coded trend direction for quick analysis.
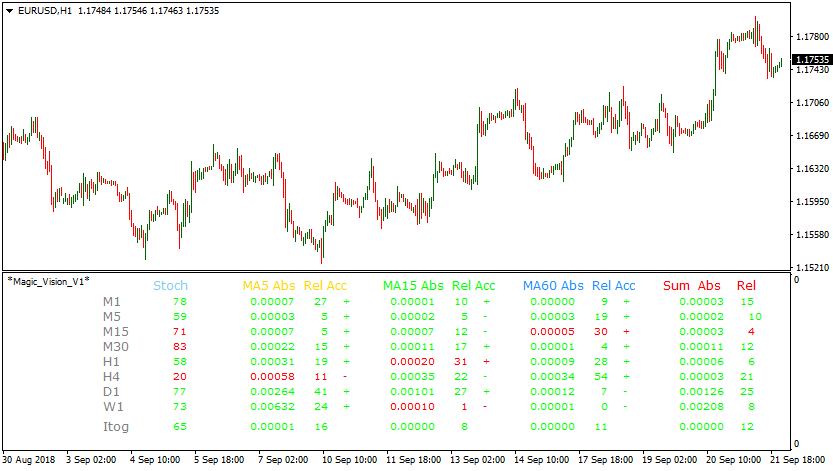
Indicator Chart
The chart shows the Magic Vision Dashboard indicator active alongside price action.
The dashboard changes color based on moving average alignment, signaling whether bullish or bearish conditions dominate.
Traders use this view to confirm trend direction before executing trades.
Guide to Trade with the Magic Vision Dashboard Indicator
Buy Rules
- Scan the dashboard for a green color on the chosen pair.
- Confirm the green signal appears on your trading timeframe.
- Check that price is moving consistently upward.
- Open a buy trade at the next candle open.
Sell Rules
- Identify a red dashboard signal for the selected pair.
- Confirm the red color aligns with your trading timeframe.
- Ensure price action supports bearish movement.
- Enter a sell trade at the opening of the next candle.
Stop Loss
- Place the stop beyond recent price consolidation.
- Use a percentage-based risk stop per trade.
- Exit if the dashboard switches to a neutral or opposite color.
Take Profit
- Close the trade when the dashboard changes color.
- Target recent swing highs or lows.
- Trail the stop while the dashboard remains aligned.
- Exit manually if momentum slows significantly.
Magic Vision Dashboard + Detrended Synthetic Price Histogram MT4 Strategy
This strategy combines the Magic Vision Dashboard MT4 Forex Indicator and the Detrended Synthetic Price Histogram MT4 Forex Signals Indicator to identify high-probability trades in trending markets.
The Magic Vision Dashboard provides an overall market bias using clear color-coded signals. Green indicates a buy bias while red indicates a sell bias.
The Detrended Synthetic Price Histogram confirms the trend direction with its own color-coded display.
Green histogram bars indicate a bullish trend and red bars indicate a bearish trend.
By combining these two indicators, traders can enter trades with more confidence, filtering out false signals that occur in choppy market conditions.
This strategy is suitable for H1 and H4 time frames.
It works well for swing traders and medium-term traders who prefer a structured approach without complicated calculations.
By waiting for confirmation from both indicators, traders can align with the overall market trend and reduce the risk of entering against the momentum.
The strategy is simple to follow, easy to read visually, and adaptable to multiple currency pairs.
Buy Entry Rules
- Magic Vision Dashboard turns green, indicating a valid buy signal.
- The Detrended Synthetic Price Histogram shows green, confirming an upward trend.
- Enter a buy trade at the open of the next candle after both signals align.
- Place a stop loss below the most recent swing low.
- Set take profit at 1.5 to 2 times the stop-loss distance, or exit when either the Histogram turns red or the Dashboard turns red.
Sell Entry Rules
- Magic Vision Dashboard turns red, indicating a valid sell signal.
- The Detrended Synthetic Price Histogram shows red, confirming a downward trend.
- Enter a sell trade at the open of the next candle after both signals align.
- Place a stop loss above the most recent swing high.
- Set take profit at 1.5 to 2 times the stop-loss distance, or exit when either the Histogram turns green or the Dashboard turns green.
Advantages
- Clear visual signals make it easy for beginners and experienced traders.
- Combining the dashboard and histogram reduces false entries.
- Works well on multiple time frames and currency pairs.
- Flexible exit options with fixed targets or dynamic exits based on indicator changes.
Drawbacks
- No built-in volatility filter, so traders need to monitor market conditions.
- Requires discipline with stop-loss placement and risk management.
Example Case Study 1
On AUDUSD H4, the Magic Vision Dashboard turned green while the Detrended Synthetic Price Histogram showed green.
A buy trade was entered at 0.6920. Stop loss was set at 0.6860 below the recent swing low.
Take profit was set at 0.7010.
The price steadily rose over the next two days and reached the take profit, giving a 90-pip gain.
The combination of dashboard and histogram signals filtered out minor retracements during the Asian session, allowing a clean trend trade.
Example Case Study 2
On USDJPY H1, the Magic Vision Dashboard turned red and the Detrended Synthetic Price Histogram also turned red.
A sell trade was entered at 146.50 with a stop loss at 146.80.
The take profit was set at 145.90.
The price moved down steadily over the next 12 hours and hit the target for a 60-pip profit.
The dual confirmation helped avoid entering a trade too early during a minor pullback and ensured alignment with the overall trend.
Strategy Tips
- A green Dashboard display signals a buy opportunity. A red Dashboard display signals a sell opportunity.
- Use the Detrended Synthetic Price Histogram to confirm trend direction before entering.
- Prefer higher time frames like H1 and H4 to reduce noise and increase reliability.
- Check for support and resistance levels to improve entry and exit points.
- Risk no more than 1-2 percent of your account per trade to manage drawdowns.
- Avoid trading during very low volume periods when signals may be less reliable.
- Use the dual confirmation to filter out minor counter-trend moves and stay with the main trend.
- Keep a trading journal to track performance across different pairs and sessions.
Download Now
Download the “magic-vision.mq4” Metatrader 4 indicator
FAQ
How does the Magic Vision Dashboard determine trend direction?
It analyzes the alignment of three moving averages to assess bullish or bearish momentum.
Can the dashboard monitor multiple timeframes?
Yes, it supports all timeframes starting from the 1-minute chart.
Does the dashboard replace chart-based indicators?
No, it works best as a trend overview tool that complements chart analysis.
Summary
The Magic Vision Dashboard indicator delivers a practical overview of market trends using multiple moving averages.
Its dashboard format allows traders to track several pairs and timeframes efficiently.
By focusing on trend alignment rather than individual signals, it helps traders stay positioned in the dominant market direction.


