
About the Support & Resistance Levels II indicator
The Support & Resistance Levels II indicator for MT4 scans for all significant support and resistance levels on any currency pair and timeframe.
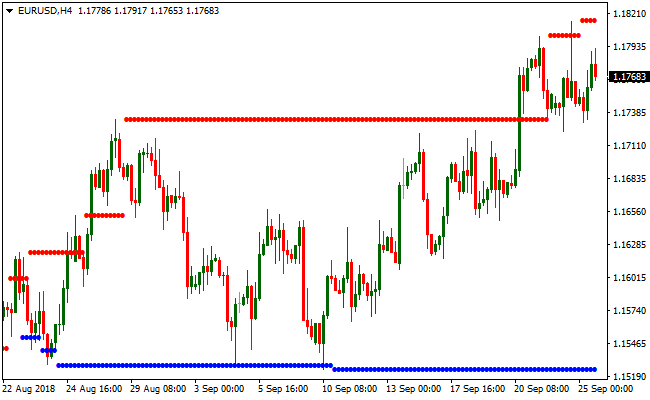
Support levels appear in blue, while resistance levels appear in red, giving traders a clear view of key market barriers.
These levels are essential for identifying breakout opportunities, setting effective stop losses, and determining take profit targets.
The indicator can highlight both minor and major levels, depending on the precision setting chosen.
For practical use, I often set the indicator’s precision input to 2500.
This adjustment filters out minor fluctuations and focuses on the major support and resistance zones that have the highest impact on price movement.
Traders can use this tool independently to trade breakouts or combine it with trend-following indicators to improve trade accuracy.
Free Download
Download the “support-resistance-levels.ex4” MT4 indicator
Key Features
- Detects both minor and major support and resistance levels automatically.
- Color-coded levels: blue for support, red for resistance.
- Scans all timeframes and currency pairs for key levels.
- Customizable precision to highlight major zones or include minor levels.
- Useful for breakout trading, stop-loss placement, and profit targets.
Indicator Chart
The chart below shows red resistance lines and blue support lines across the selected timeframe.
Forex traders can easily spot breakout opportunities, identify strong barriers, and plan trades with clear entry, stop-loss, and take profit zones.
Guide to Trade with Support & Resistance Levels II Indicator
Buy Rules
- Enter a long trade when price breaks and closes above major resistance (red line).
- Confirm breakout with increased volume or trend confirmation.
- Avoid buying if price is near another strong resistance zone above.
- Combine with momentum indicators for higher probability setups.
Sell Rules
- Open a short trade when price breaks and closes below major support (blue line).
- Confirm the breakout with downward momentum or trend confirmation.
- Avoid selling near a strong support zone below the current price.
- Combine with trend indicators to filter false breakouts.
Stop Loss
- Set stop loss slightly below the broken resistance for buy trades.
- Set stop loss slightly above the broken support for sell trades.
- Adjust stop based on recent price swings or market volatility.
- Consider using a buffer of a few pips beyond the level to avoid false stops.
Take Profit
- Close long positions at the next significant resistance level above the entry.
- Close short positions at the next major support level below the entry.
- Optionally use a trailing take profit to follow extended price moves.
- Adjust take profit based on market volatility or chart patterns.
Support Resistance Levels II + Zero Lag MACD Forex Scalping Strategy
This MT4 scalping strategy combines the structured price levels from the Support Resistance Levels II indicator with the momentum confirmation from the Zero Lag MACD indicator.
Support appears as blue dotted lines while resistance appears as red dotted lines.
The Zero Lag MACD provides the directional bias. When MACD is above zero, it signals bullish momentum and when it is below zero, it signals bearish momentum.
This strategy is designed for scalping on M5 and M15 charts. It works well on major pairs with good liquidity.
The goal is to use support and resistance levels as entry zones and the Zero Lag MACD as confirmation for momentum.
Buy Entry Rules
- Price must touch or come close to a blue support level.
- The Zero Lag MACD must be above the zero line.
- Enter a buy trade when price rejects the support and forms a bullish confirmation candle.
- Place the stop loss a few pips below the support line.
- Take profit at the next red resistance level or when MACD weakens toward zero.
Sell Entry Rules
- Price must touch or come close to a red resistance level.
- The Zero Lag MACD must be below the zero line.
- Enter a sell trade when price rejects the resistance and forms a bearish confirmation candle.
- Place the stop loss a few pips above the resistance line.
- Take profit at the next blue support level or when MACD weakens toward zero.
Advantages
- Clear support and resistance zones help define precise entries.
- Zero Lag MACD adds fast momentum confirmation for quick scalping decisions.
- Works well on major pairs with low spreads.
- Simple rules make it suitable for new scalpers.
Drawbacks
- Sideways markets may produce false entries near levels.
- Thin-volume periods reduce the reliability of support and resistance reactions.
- Stop losses can be hit quickly if a level breaks sharply.
- Requires active monitoring on lower time frames.
Case Study 1
On EURUSD M5, price moved downward toward a blue support level at 1.09850.
It touched the level and rejected with a bullish candle closing back above 1.09855.
At the same time the Zero Lag MACD crossed above zero which confirmed bullish momentum.
A buy trade was entered at 1.09855 with a stop loss at 1.09820.
The next red resistance was located at 1.09930.
Price climbed steadily and reached 1.09928, generating a gain of about 7 pips before momentum weakened.
Case Study 2
On USDJPY M15, price rallied into a red resistance level at 149.45.
A rejection candle formed with a clear upper wick and the Zero Lag MACD dropped below zero at the same time.
A sell trade was opened at 149.44 with a stop loss at 149.60.
The next blue support was at 149.10.
Price fell strongly during the next session and reached 149.12, giving a profit of about 32 pips before momentum slowed.
Strategy Tips
- Avoid trading when support and resistance levels are clustered too closely together.
- Wait for a clear rejection candle before entering, not just a touch of the level.
- Exit early if MACD starts pulling back toward zero even before reaching the opposite level.
- Keep stop losses tight because scalping relies on small but frequent opportunities.
Download Now
Download the “support-resistance-levels.ex4” Metatrader 4 indicator
FAQ
Can I use this indicator for all currency pairs?
Yes, the indicator works on any forex pair and timeframe.
Major levels are reliable across all instruments, while minor levels may vary.
What does the precision setting do?
The precision input controls which levels are displayed.
Higher values filter out minor levels, highlighting only the most important support and resistance zones.
Is it suitable for breakout trading?
Yes, this indicator is ideal for breakout strategies.
Price breaking a major level signals potential strong movement in that direction.
Summary
The Support & Resistance Levels II indicator is a powerful tool for spotting key market levels.
Its clear color-coded support and resistance lines make breakout trading simple and help manage risk with precise stop-loss and take profit placement.
With customizable precision, traders can focus on major levels for higher probability trades.
Overall, it improves trade planning, timing, and overall strategy execution.


