About the ADX Buy/Sell Cross Signals Indicator
The ADX Buy/Sell Cross Signals indicator for MT4 generates clear buy and sell signals using DI+ and DI- crossovers.
A blue arrow signals a bullish trend when DI+ crosses above DI-.
A red arrow signals a bearish trend when DI- crosses above DI+.
This indicator works best in trending markets and may produce false signals during sideways conditions.
Use it alongside a trend-following indicator, like a 75-period EMA or 100-period SMA, to improve accuracy.
Trade only signals aligned with the overall trend.
For instance, if the price is above the trend line, focus on the blue buy arrows.
If the price is below, focus on the red sell arrows.
The default ADX period is 14, but you can adjust it in the inputs tab to suit your strategy.
Free Download
Download the “adx-buy-sell.mq4” MT4 indicator
Key Features
- Generates buy and sell arrows based on DI+ and DI- crossovers.
- Blue arrow signals a bullish trend, red arrow signals a bearish trend.
- Works best in trending markets, reduces false signals when used with a trend filter.
- Adjustable ADX period to match your trading style.
- Compatible with trend-following indicators for higher accuracy.
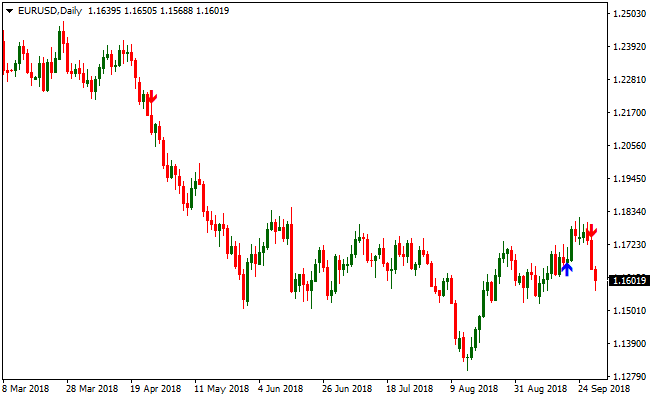
Indicator Chart
The chart shows blue and red arrows indicating buy and sell signals.
Blue arrows mark bullish DI+ crossovers, red arrows mark bearish DI- crossovers.
Traders can quickly see when to enter trades aligned with the overall trend.

Guide to Trade with ADX Buy/Sell Cross Signals Indicator
Buy Rules
- Open a buy trade when a blue arrow appears.
- Ensure the overall trend is upward using a trend-following indicator.
- Focus on arrows that appear after price confirms the trend.
- Avoid buying if the trend is downward or price is in a sideways range.
Sell Rules
- Open a sell trade when a red arrow appears.
- Ensure the overall trend is downward using a trend-following indicator.
- Focus on arrows that appear after price confirms the trend.
- Avoid selling if the trend is upward or price is in a sideways range.
Stop Loss
- For buy trades, place the stop just below the most recent swing low.
- For sell trades, place the stop just above the most recent swing high.
- Optionally, use the opposite arrow or previous trend signal as a reference for your stop.
Take Profit
- Close buy trades when a red arrow appears on the chart.
- Close sell trades when a blue arrow appears on the chart.
- Optionally, take profit at a fixed pip target according to your preferred risk-reward setup.
ADX Buy/Sell Cross Signals + Trend Master Forex Day Trading Strategy
This day trading strategy for MT4 combines the ADX Buy/Sell Cross Signals Indicator with the Trend Master Indicator.
The Trend Master shows the market trend with arrows: a blue arrow signals a bullish trend, a red arrow indicates a bearish trend.
The ADX Buy/Sell Cross Signals adds timely entry signals: a blue arrow for a buy, a red arrow for a sell.
By using both indicators together, you align entries with the overall trend and increase the chance of catching strong intraday moves.
This strategy works on M15 and H1 charts and fits traders who want clear, rule-based setups for major currency pairs during active market hours.
Buy Entry Rules
- Confirm the most recent arrow from Trend Master is blue, indicating a bullish trend.
- Wait for a blue arrow from the ADX Buy/Sell Cross Signals while the trend remains bullish.
- Enter a long (buy) trade as soon as the blue ADX signal arrow appears.
- Place a stop loss a few pips below the recent swing low (or a recent support area).
- Set take profit at the next significant resistance level or previous swing high.
Sell Entry Rules
- Confirm the most recent arrow from Trend Master is red, indicating a bearish trend.
- Wait for a red arrow from the ADX Buy/Sell Cross Signals while the trend remains bearish.
- Enter a short (sell) trade when the red ADX signal arrow appears.
- Place a stop loss a few pips above the recent swing high (or a recent resistance area).
- Set take profit at the next significant support level or previous swing low.
Advantages
- Combines trend direction with entry signals, reducing counter‑trend risk.
- Clear arrows make entries easy to identify, even for less experienced traders.
- Works well on M15 and H1 charts, offering flexibility for both quick-day trades and slightly longer swings.
- Suitable for major forex pairs where price tends to respect support and resistance zones.
- Helps avoid emotional trading by following fixed rules.
Drawbacks
- In ranging or choppy markets, signals can be misleading and result in false entries.
- Waiting for both trend and signal confirmation may result in missing the early part of the move.
Example Case Study 1 – EURUSD H1
During an uptrend on EURUSD H1, Trend Master displayed a blue arrow indicating a bullish trend.
Shortly after, the ADX indicator issued a blue arrow at 1.1125.
A buy trade was placed with a stop loss 10 pips below the recent swing low at 1.1115.
Over the next several hours, price climbed steadily and reached the next resistance zone at 1.1190, giving a profit of 65 pips.
Example Case Study 2 – GBPUSD M15
On GBPUSD M15 during a London–New York overlap session, Trend Master showed a red arrow indicating a bearish trend.
The ADX indicator then produced a red arrow at 1.2758.
A sell trade was opened with a stop loss 8 pips above the recent swing high at 1.2766.
The pair moved downward under bearish pressure and hit the next support zone at 1.2675 over the following hours.
The trade closed for a profit of 83 pips as momentum slowed and price began consolidating.
Strategy Tips
- Wait for both the Trend Master and ADX signal arrows to align before entering to ensure high-probability trades.
- Use higher timeframe confirmation (H4) to verify the overall market trend before taking M15 or H1 trades.
- Consider partial profit taking at key intraday levels to lock in gains while letting the remainder run.
- Adjust stop loss based on recent price action rather than fixed pips to account for volatility changes.
- Avoid trading in low-volume periods, such as the Asian session for non-Asian pairs, to reduce choppy movements.
- Keep a consistent trading routine with predefined entry, exit, and risk management rules.
- Monitor correlation between pairs to avoid multiple trades in highly correlated pairs simultaneously, which can increase risk.
- Use a small trailing stop once the trade moves in your favor to capture extended trends while protecting profit.
- Review daily performance to identify patterns, mistakes, and pairs that perform best with this strategy.
Download Now
Download the “adx-buy-sell.mq4” Metatrader 4 indicator
FAQ
Which instruments can I trade with this indicator?
This indicator works primarily on forex pairs but can also be applied to indices and other charted instruments.
How should I filter false signals?
Use a trend-following tool like a 75-period EMA or 100-period SMA to confirm the trend before trading arrows.
Can I adjust the ADX settings?
Yes, the default period is 14, but it can be modified in the inputs tab to match your trading style.
Summary
The ADX Buy/Sell Cross Signals indicator for MT4 provides Forex traders with clear entry points using DI+ and DI- crossovers.
Blue and red arrows make trend direction easy to follow.
This indicator is ideal for spotting trend changes and entering trades in line with the overall market.
Combined with a trend-following filter, it helps focus on higher-probability setups and manage risk efficiently.


